Wednesday, January 8, 2014

HQ #2 - ExxonMobil


ExxonMobil is building a massive new campus in The Woodlands, Texas, north of Houston about 20 miles.  The campus will be on 385 acres and cost $1.2 billion and have space for 10,000 employees.

However, Exxon is such a massive company that this will only be one of its campuses.  Its corporate headquarters remain in the Las Colinas area of Irving Texas.


Mustangs running through Las Colinas.

Exxon moved its headquarters to Irving from Rockefeller Plaza in NYC in the early 1990s.  Mobil had its headquarters in Fairfax County, Virginia, before merging with Exxon in 1999.  Exxon's HQ is apparently just a single office building with a few hundred employees.  I can't find much detailed information.

Headquarters #1. The Republic of Apple


I think it will be interesting to do a series on the headquarters of the biggest companies. Apple is #1 on the list, and they are building a spaceship in Cupertino, California at a cost of more than $5 billion.  The 4 story building will have 2.8 million square feet of space over 4 stories. The campus is 175 acres of prime land in the heart of Silicon Valley.  (The architect is the renowned Lord Norman Foster, who also designed the HSBC building in Hong Kong and futuristic buildings in Astana, Kazakhstan).

I call it the Republic of Apple, because they are the biggest tax avoider in the world.  They have declared themselves a "sovereign nation" for tax purposes and since nobody is challenging them on it they have succeeded.  They have over $100 billion in cash in offshore bank accounts, and they are very well connected in Washington.  They will probably be the world's first trillion dollar corporation.

M6

M6 is the name of my new index. This isn't the best name, but I can't think of anything better at the moment.  It is my M5 index, plus the market cap of the Global 30 companies.  It has four components:  M2, the debt held by the public, less Treasuries owned by the Fed, plus the Global 30 market cap.  (I subtract Treasuries owned by the Fed so they aren't counted twice.  Otherwise those would be included in both M2 and the debt held by the public).

At first, it seems like just a collection of random numbers.  But it represents first of all, a portfolio that a prudent wealth person might own.  About 37% in cash, 40% in bonds and 23% in stocks.  Actually a wealthy person wouldn't have that much in cash, but they might if they were really risk-adverse, plus consider that this "cash" is M2, which keeps going up at 5-10%/year, so it is getting interest.

I want it to represent an expanded view of money supply.  Money is not just the coins in your pocket and the Federal Reserve notes in your wallet.  It also includes the money in your checking account.  And US T-bills that you own that are as good as cash.  It also includes stocks in massive companies that you own, that are easily sold for cash.

Note that I am including only the Global 30 stocks for several reasons.  If the Fed (or the Social Security Trust Fund) were to buy stocks, which they might some day, these would be the ones they would most likely buy.  Also these are all too big too fail companies.  They will all be around, in one form or another, in 100 years.  And the newly created money goes mostly into the stock market.

It shows my theory of money.  Where does money come from?  First, intrinsic money, coins.  Second, private banks create it through loans.  Third, the government creates it by issuing debt. Fourth, the Federal Reserve creates it by buying things besides government debt.  Fifth, the stock market creates it.

It don't want to overstate its importance, it is just a number.  My baseline is 9/30/2013. I don't want to go back before that as it is too much work, but somebody could if this is a useful tool.

M6 as of 9/30/13


M2 10,880.8
Public Debt 11,976.3
Less Fed Treasuries -2,076.9
Global 30 Market Cap 6,409.2

27,189.4

I think I will update this at least quarterly going forward.  I will do the comparison for 12/31/13 in a few day when I get some more data.  I think it will be very interesting.

The M6 number should never go down. If it does, everyone freaks out.  If there is a stock market crash, then that means we are in a recession and deficit spending will increase in an attempt to compensate.  (Note that stocks are only 23% of the total so even a 20% drop won't have that big of an effect on the total).

This shows something else.  The US is a half-capitalistic, half-socialistic country.  Everyone agrees that we want the capitalist side to succeed - jobs are good.  But when the capitalist side isn't working (a recession) that is when the socialist side kicks in.

=======================
Update:  I revised the Global 30 Market Cap as of 9/30/13 to be 6,327.8 with the addition of Facebook and the removal of PetroChina.  This changes M6 as of 9/30/13 to 27,108.0.

=======================
Update 2:  With the other changes (G30 stocks at 6,154.6) , the total is now 26,934.8 as of 9/30/13.

The Global 30 as of Sept 30

For comparison purposes, here is the Global 30 market cap as of 9/30/13.  There might be some minor errors here with the number of shares.  Companies are always issuing stock options, giving stock dividends, or buying back shares.  But I think it is pretty accurate.  Banks are in bold.

Symbol Company Shares (M) Price Total (M)
AAPL Apple Inc 899.7 473.98 426,440
XOM Exxon Mobil 4370 85.46 373,460
GOOG Google 334.09 875.91 292,633
BRK-A Berkshire Hathaway 1.65 170,410 281,177
MSFT Microsoft 8350 33.03 275,801
JNJ Johnson Johnson 2820 86.09 242,774
GE General Electric 10120 23.70 239,844
WMT Wal-Mart 3240 73.53 238,237
CVX Chevron 1920 120.49 231,341
CHL China Mobile Ltd 4020 56.43 226,849
WFC Wells Fargo 5270 41.03 216,228
HSBC HSBC Holdings 4000 53.78 215,120
RDS-B Royal Dutch Shell 3140 67.95 213,363
PTR Petrochina 1860 109.95 204,507
PG Proctor Gamble 2720 75.00 204,000
TM Toyota Motor Co 1580 128.03 202,287
IBM IBM 1090 184.19 200,767
JPM JP Morgan Chase 3760 50.65 190,444
NVS Novartis 2440 76.71 187,172
PFE Pfizer 6480 28.51 184,745
BHP BHP Billiton Ltd 2660 66.50 176,890
T ATT 5270 33.37 175,860
VOD Vodafone 4860 34.65 168,399
KO Coca Cola 4420 37.62 166,280
BUD Anheuser-Busch 1600 98.42 157,472
ORCL Oracle 4540 32.95 149,593
BAC Bank of America 10670 13.79 147,139
C Citigroup 3030 48.50 146,955
AMZN Amazon 457.7 312.64 143,095
BP BP plc 3140 41.52 130,373


Total

6,409,245

Not all of these went up between 9/30 and 12/31.  Notably, Toyota dropped from 128.03 to 121.92, and China Mobile dropped from 56.43 to 52.29.  Petrochina dropped from 109.95 to 109.74.  The rest of the companies rose, most by more than 10%.

See also The Global 30

=====================================================
Facebook (FB) has 2.45 billion shares outstanding.  On 9/30/13, it had a share price of 50.23, given it a market cap at that time of 123,064.

Removing PTR and adding FB gives the Global 30 a total of 6,327,802.

=====================================================
Adding Merck (MRK) and Comcast (CMCSA) and dropping CHL and TM gives this a total of 6,154,645 as of 9/30/13.

Tuesday, January 7, 2014

You're as cold as ice


"Temperatures in the wake of a stubborn weather pattern that dropped several inches of snow could be summed up in a single word: brutal. At 7 a.m., O'Hare International Airport recorded a temperature of -15, breaking a record low of -14 set on this date in both 1894 and 1988. By 8:30 a.m., the official Chicago temperature had dipped another degree, to -16.  With the wind chill factored in, Monday's temperatures were in the -40 to -50 degree range and even lower across the Fox Valley.  By midday, the lowest recorded wind chill was in Aurora, at -47 degrees. DuPage and Porter recorded -46 degrees and O'Hare reported -42 degrees."
Source: http://www.nbcchicago.com/weather/stories/Dangerous-Cold-Temps-Chicago-238467651.html

Saturday, January 4, 2014

The former congressman who is now a prepper


Roscoe Bartlett

The octogenarian Republican from western Maryland—more than once labeled “the oddest congressman”—found himself gerrymandered out of office a year ago and promptly decided to take action on the warnings others wouldn’t heed, retreating to a remote property in the mountains of West Virginia where he lives with no phone service, no connection to outside power and no municipal plumbing. Having failed to safeguard the power grid for the rest of the country, Bartlett has taken himself completely off the grid. 

Read more: http://www.politico.com/magazine/story/2014/01/roscoe-bartlett-congressman-off-the-grid-101720.html

Friday, January 3, 2014

Denninger on Thorium

China's Local Debts Reach 18 Trillion Yuan


That's about $3 trillion.

"China's mountain of local government debt is among the biggest threats to its economy as investors worry a good part of it cannot be repaid since most of the money borrowed had paid for non-lucrative public infrastructure."
--http://www.reuters.com/article/2013/12/30/us-china-economy-debt-idUSBRE9BT09M20131230

Chinese money supply


2013-10: 107,024,216,664,233.000
At an exchange rate of 6.05 CNY to 1 USD, that is about $17.7 trillion.


2013-10: 5,559,572,018,797.3799, or about $919 billion.

They haven't discovered Japan or US-style QE yet.

Thursday, January 2, 2014

The Global 30

The Global 30 are the biggest companies in the world by market cap.  These are all American companies or listed on the NYSE.  There are some other large companies from China and Switzerland that could be listed, but they aren't on the NYSE.  I find this list interesting for reasons I will explain below.  This is the market cap of the companies as of 12/31/13.

Symbol Company Market Cap
AAPL Apple Inc 504,750
XOM Exxon Mobil 439,622
GOOG Google 374,418
MSFT Microsoft 312,374
BRK-A Berkshire Hathaway 293,535
GE General Electric 283,664
JNJ Johnson and Johnson 258,284
WMT Wal-Mart 254,956
CVX Chevron 239,827
WFC Wells Fargo 239,258
RDS-B Royal Dutch Shell 235,845
PG Proctor Gamble 221,435
HSBC HSBC Holdings 220,520
JPM JP Morgan Chase 219,885
CHL China Mobile Ltd 210,206
IBM IBM 204,451
PTR Petrochina 204,116
PFE Pfizer 198,482
NVS Novartis 196,127
TM Toyota Motor Co 192,634
VOD Vodafone 191,047
T ATT 185,293
KO Coca Cola 182,590
AMZN Amazon 182,526
BHP BHP Billiton Ltd 181,412
ORCL Oracle 173,700
BUD Anheuser-Busch 170,336
BAC Bank of America 166,132
C Citigroup 157,893
BP BP plc 152,635


Total 7,047,954

These companies make up almost half of the market cap of the NYSE, the largest stock exchange in the world. (Note that Microsoft is listed on NASDAQ not the NYSE).  (See also an earlier post showing a total cap of 6,919,352).

I have been following an expanded definition of money supply, which includes US government debt.  Could stocks also fit into an expanded definition of money?  I think that they could for several reasons.  First, they are highly liquid and very easy to sell.  Instead of keeping money in your bank account you might decide to buy stocks instead.  And when the prices go up, people think they are wealthier and will spend more.  Second, for the larger companies at least, they can treat their stock as money in paying employees or buying up competitors. Third, a lot of the newly created money goes into the stock market.

Ok, but why focus on just these companies and not every stock listed?  Primarily because it is hard to get the data.  But also because there is something interesting about a huge company like Apple that is bigger than most countries.

So I think I may publish stats that includes this in the total.  Note that the total public government debt of 12.3 trillion dwarfs this number.

=======================
Update:
Facebook (FB) has 2450 M shares outstanding.  As of 12/31/13, it had a share price of 54.65, giving this a market cap of $133,893 million.

Removing PetroChina (PTR) and adding FaceBook, gives this a revised value of 6,977,731.

======================
Update 2:
I'm thinking about adding 3 more companies to the list: Comcast (CMCSA), Verizon (VZ), and Merck (MRK).  I am going to hold off for now until their market cap breaks $150B.  Facebook is below $150B, but skyrocketing.

Wednesday, January 1, 2014

Machakos, Kenya

Jeddah

SP 500 and Base


Must be a coincidence.

Repent Walpurgis


I detest hippy music (anything that might have been played at Woodstock), but this band is extremely talented, especially the pianist, who obviously was trained on classical music and combines it with the jam.

Beethoven Virus

Monday, December 30, 2013

Xiamen is the San Diego of China

San Diego, California "is the birthplace of California and is known for its mild year-round climate, natural deep-water harbor, extensive beaches, long association with the U.S. Navy, and recent emergence as a healthcare and biotechnology development center". The population was estimated to be 1,322,553 as of 2012.  It has a very high quality of life.  It is 2600 miles from San Diego to Honolulu.


San Diego

Xiamen, Fujian province, has a population of 3.67 million.  "Xiamen and its surrounding countryside is known for its scenery and tree-lined beaches. Xiamen has a monsoonal humid subtropical climate characterised by long, hot and humid summers (but moderate compared to much of the rest of the province) and short, mild and dry winters.  The Port of Xiamen is a large deepwater port situated on the northern part of Xiamen Island. It has an excellent natural harbour and well connected to the mainland by road and rail. Xiamen University is a beautiful campus with old traditional buildings and a tranquil lake outside the foreign language department.  In 2006, Xiamen was ranked as China's second 'most suitable city for living', as well as China's 'most romantic leisure city' in 2011."  It is about 190 miles from Xiamen to Taipei.


Xiamen

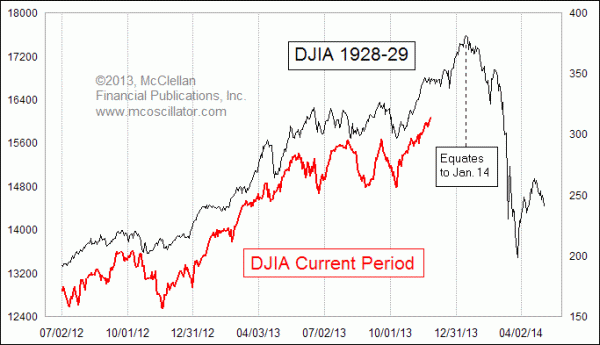
Crash on January 14, 2014?


I don't think so, but if the current correlation holds it will.


100 Best Cities in the World

This list combines quality of life rankings (from Mercer) with GDP/Population.  The result is a city that has a very nice atmosphere and also provides a nice standard of living.  So bigger is better (more opportunity), but with too big a city you get smog and traffic and pay higher rent.  This attempts to show the optimum balance.  A lower score is better here.  These are in caps because one of my sources was in caps and it is too much work to modify.

To show an example of how this works, Vienna is ranked #1 for quality of life, but #81 in power, for a point score of 82. Tokyo is ranked #66 for quality of life, but #1 in power, for a total of 67.

There is a bias in favor of European cities (especially Germany) and against China, but that is what the survey results show. US cities are in bold.

1 DÜSSELDORF (Rhine-Ruhr) GERMANY 33
2 SYDNEY AUSTRALIA 36
3 PARIS FRANCE 38
4 TORONTO CANADA 39
5 SINGAPORE SINGAPORE 42
6 AMSTERDAM/ROTTERDAM (Randstad) NETHERLANDS 53
7 MELBOURNE AUSTRALIA 54
8 LONDON UK 55
9 SAN FRANCISCO/ OAKLAND/SAN JOSE, CA US 58
10 NEW YORK CITY, NY US 60
11 CHICAGO, IL US 63
12 FRANKFURT GERMANY 67
13 TOKYO/YOKOHAMA JAPAN 67
14 BOSTON, MA US 68
15 WASHINGTON, DC US 73
16 OSAKA/KOBE/KYOTO JAPAN 76
17 BERLIN GERMANY 77
18 MONTREAL CANADA 79
19 VIENNA AUSTRIA 82
20 MILAN ITALY 95
21 LOS ANGELES, CAUS 95
22 HAMBURG GERMANY 104
23 BARCELONA SPAIN 105
24 MADRID SPAIN 109
25 PHILADELPHIA, PA US 109
26 BRUSSELS BELGIUM 110
27 VANCOUVER CANADA 112
28 DALLAS, TX US 112
29 HOUSTON, TX US 113
30 STOCKHOLM SWEDEN 118
31 SEATTLE, WA US 124
32 NAGOYA JAPAN 125
33 COPENHAGEN DENMARK 126
34 HONG KONG HONG KONG 127
35 MIAMI, FL US 131
36 SEOUL/INCHEON SOUTH KOREA 133
37 LISBON PORTUGAL 136
38 ATLANTA, GA US 136
39 MUNICH GERMANY 137
40 SAN DIEGO, CA US 142
41 ROME ITALY 142
42 MINNEAPOLIS/ST. PAUL, MN US 154
43 BRISBANE AUSTRALIA 155
44 DENVER, CO US 155
45 FUKUOKA JAPAN 155
46 BIRMINGHAM UK 161
47 BUENOS AIRES ARGENTINA 162
48 NAPLES ITALY 164
49 PERTH AUSTRALIA 169
50 PORTLAND, OR US 185
51 DUBAI/SHARJAH UNITED ARAB EMIRATES 186
52 SHANGHAI CHINA 186
53 TAIPEI TAIWAN 187
54 PHOENIX/SCOTTSDALE, AZ US 188
55 DUBLIN IRELAND 190
56 MANCHESTER UK 196
57 KUALA LUMPUR MALAYSIA 198
58 DETROIT, MI US 202
59 BEIJING CHINA 209
60 ZURICH SWITZERLAND 211
61 PITTSBURGH, PA US 213
62 BUSAN SOUTH KOREA 213
63 OSLO NORWAY 215
64 SAO PAULO  BRAZIL 216
65 BALTIMORE, MD US 219
66 SANTIAGO CHILE 221
67 ST. LOUIS, MO US 222
68 TAMPA, FL US 222
69 LEEDS/BRADFORD (WEST YORKSHIRE) UK 223
70 ATHENS GREECE 223
71 HANGZHOU CHINA 225
72 GUANGZHOU/FOSHAN CHINA 226
73 AUCKLAND NEW ZEALAND 228
74 SAPPORO JAPAN 228
75 MEXICO CITY MEXICO 232
76 ISTANBUL TURKEY 233
77 BANGKOK THAILAND 235
78 KANSAS CITY, MO US 238
79 RIO DE JANEIRO BRAZIL 239
80 TEL AVIV ISRAEL 245
81 STUTTGART GERMANY 246
82 AUSTIN, TX US 247
83 JOHANNESBURG SOUTH AFRICA 249
84 BUDAPEST HUNGARY 258
85 CALGARY CANADA 259
86 CINCINNATI, OH US 260
87 LYON FRANCE 261
88 LAS VEGAS, NV US 262
89 SHENZHEN CHINA 264
90 MONTERREY MEXICO 265
91 KUWAIT CITY KUWAIT 265
92 ABU DHABI UNITED ARAB EMIRATES 266
93 WARSAW POLAND 266
94 CLEVELAND, OH US 267
95 BELO HORIZONTE BRAZIL 268
96 SAN ANTONIO, TX US 269
97 CAPE TOWN SOUTH AFRICA 269
98 TIANJIN CHINA 272
99 ORLANDO, FL US 273
100 HELSINKI FINLAND 276

Sunday, December 29, 2013

Chengdu

Saturday, December 28, 2013