9/30/2008 10025
9/30/2009 11910
9/30/2010 13561
9/30/2011 15528
9/30/2012 17780
9/30/2013 20358
9/30/2014 23310
9/30/2015 26689
9/30/2016 30559
9/30/2017 34990
9/30/2018 40064
9/30/2019 45873
9/30/2020 52525
9/30/2021 60141
9/30/2022 68861
9/30/2023 78847
9/30/2024 90279
9/30/2025 103370
So what does this mean? At some point relatively soon, the whole system will skyrocket out of control. What is my best guess for when this will happen? Well, if my theory about 10 times revenue being the breaking point is correct, I see this happening sometime in 2017. Revenue in FY 2017 is projected at $3.477 trillion, with national debt at $34.990 trillion.
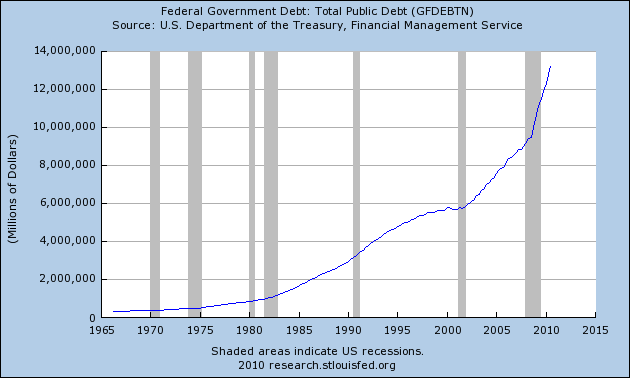
I've been wrong before and I hope I am wrong here, but this is scary. When I first started this blog, I was projected the endpoint as being in 2022, thus the name of the blog. Then I bumped it to 2028, then I lowered it to 2025. Now I think the end will occur much sooner. Maybe I am being paranoid, but check out the slope on this graph from official federal reserve data:
Update 6/19/2012: This is model D-1 and is discredited, because the debt isn't increasing that fast.
No comments:
Post a Comment