Friday, January 31, 2014
G30 as of 1/31/14
| Shares (M) | Shares (M) | Price | Price | Total (M) | Total (M) | |||
| Rank | Symbol | Company | 12/31/13 | 01/31/14 | 12/31/13 | 01/31/14 | 12/31/13 | 01/31/14 |
| 1 | AAPL | Apple Inc | 899.7 | 892.45 | 561.02 | 500.60 | 504,750 | 446,760 |
| 2 | XOM | Exxon Mobil | 4370 | 100.6 | 92.16 | 439,622 | 402,739 | |
| 3 | GOOG | 334.09 | 1120.71 | 1,180.97 | 374,418 | 394,550 | ||
| 4 | MSFT | Microsoft | 8350 | 8300 | 37.41 | 37.84 | 312,374 | 314,072 |
| 5 | BRK-A | Berkshire Hath | 1.65 | 177,900 | 169,512 | 293,535 | 279,695 | |
| 6 | GE | General Electric | 10120 | 10090 | 28.03 | 25.13 | 283,664 | 253,562 |
| 7 | JNJ | Johnson Johnson | 2820 | 91.59 | 88.47 | 258,284 | 249,485 | |
| 8 | WMT | Wal-Mart | 3240 | 78.69 | 74.68 | 254,956 | 241,963 | |
| 9 | WFC | Wells Fargo | 5270 | 45.4 | 45.34 | 239,258 | 238,942 | |
| 10 | RDS-B | Royal Dutch Shell | 3140 | 75.11 | 72.83 | 235,845 | 228,686 | |
| 11 | CVX | Chevron | 1920 | 124.91 | 111.63 | 239,827 | 214,330 | |
| 12 | JPM | JP Morgan Chase | 3760 | 58.48 | 55.36 | 219,885 | 208,154 | |
| 13 | PG | Proctor Gamble | 2720 | 2710 | 81.41 | 76.62 | 221,435 | 207,640 |
| 14 | HSBC | HSBC Holdings | 4000 | 55.13 | 51.49 | 220,520 | 205,960 | |
| 15 | PFE | Pfizer | 6480 | 30.63 | 30.40 | 198,482 | 196,992 | |
| 16 | NVS | Novartis | 2440 | 80.38 | 79.07 | 196,127 | 192,931 | |
| 17 | IBM | IBM | 1090 | 187.57 | 176.68 | 204,451 | 192,581 | |
| 18 | VOD | Vodafone | 4860 | 39.31 | 37.06 | 191,047 | 180,112 | |
| 19 | BAC | Bank of America | 10670 | 10590 | 15.57 | 16.75 | 166,132 | 177,383 |
| 20 | T | ATT | 5270 | 5230 | 35.16 | 33.32 | 185,293 | 174,264 |
| 21 | BHP | BHP Billiton Ltd | 2660 | 68.20 | 63.95 | 181,412 | 170,107 | |
| 22 | KO | Coca Cola | 4420 | 41.31 | 37.82 | 182,590 | 167,164 | |
| 23 | ORCL | Oracle | 4540 | 4500 | 38.26 | 36.90 | 173,700 | 166,050 |
| 24 | AMZN | Amazon | 457.7 | 398.79 | 358.69 | 182,526 | 164,172 | |
| 25 | MRK | Merck | 2920 | 50.05 | 52.97 | 146,146 | 154,672 | |
| 26 | BUD | Anheuser-Busch | 1600 | 106.46 | 95.89 | 170,336 | 153,424 | |
| 27 | FB | 2450 | 54.65 | 62.57 | 133,893 | 153,297 | ||
| 28 | BP | BP plc | 3140 | 48.61 | 46.89 | 152,635 | 147,235 | |
| 29 | CMCSA | Comcast | 2620 | 2650 | 51.97 | 54.45 | 136,161 | 144,293 |
| 30 | C | Citigroup | 3030 | 52.11 | 47.43 | 157,893 | 143,713 | |
| Total | 6,857,198 | 6,564,927 |
The stocks are down 4.3% for the month.
Thursday, January 30, 2014
NYSE Margin Debt up again

Source: http://www.nyxdata.com/nysedata/asp/factbook/viewer_edition.asp?mode=table&key=3153&category=8
Somehow I doubt that it will be up again in January.
Monday, January 27, 2014
Panama canal expansion on hold
"Work on amplifying the 100-year-old waterway that connects the Pacific with the Caribbean has nearly stopped as the consortium tries to resolve a month-long dispute with the Panama Canal Authority (PCA) over $1.6 billion (some 1.2 billion euros) in cost overruns to build a new set of locks. Panamanian authorities believe that extra costs are not justified and have refused to put up any more money. ... But according to the Dispute Adjudication Board (DAB) mediation panel, which was set up to help resolve such conflicts by the PCA, if the contract with the Sacyr group is broken, the work would not be completed until between 2018 and 2020, rather than 2015 as scheduled."
http://elpais.com/elpais/2014/01/26/inenglish/1390758580_784644.html
The construction company demands more money. Panama refuses. Stalemate.
So the global boom in shipping won't happen.
See: http://aftermath2022.blogspot.com/2013/10/panama-canal-expansion-fuels-shipping.html
http://elpais.com/elpais/2014/01/26/inenglish/1390758580_784644.html
The construction company demands more money. Panama refuses. Stalemate.
So the global boom in shipping won't happen.
See: http://aftermath2022.blogspot.com/2013/10/panama-canal-expansion-fuels-shipping.html
Saturday, January 25, 2014
Abu Dhabi
Abu Dhabi is the richest city in the world. It has 9% of the proven oil reserves in the entire world. The emirate produces 93% of the oil from the UAE, and it generates 56% of the GDP of the UAE. It has a nominal GDP of 911 billion dirhams/year ($248 billion). The city only has 921,000 people. You do the math.
Dubai has the flash but Abu Dhabi has the cash. Furthermore, the ruler of Abu Dhabi is always the president of the UAE and the capital of the UAE is in Abu Dhabi.
The Abu Dhabi Investment Authority may have as much as $875 billion in assets. It is the largest sovereign wealth fund in the world and consistently generates returns of of over 7%.
Friday, January 24, 2014
December 31, 2013 was the high
Dow Jones Industrial Average
Historical Prices

Historical Prices
| Date | Close |
| 01/24/14 | 15879.11 |
| 01/23/14 | 16197.35 |
| 01/22/14 | 16373.34 |
| 01/21/14 | 16414.44 |
| 01/17/14 | 16458.56 |
| 01/16/14 | 16417.01 |
| 01/15/14 | 16481.94 |
| 01/14/14 | 16373.86 |
| 01/13/14 | 16257.94 |
| 01/10/14 | 16437.05 |
| 01/09/14 | 16444.76 |
| 01/08/14 | 16462.74 |
| 01/07/14 | 16530.94 |
| 01/06/14 | 16425.10 |
| 01/03/14 | 16469.99 |
| 01/02/14 | 16441.35 |
| 12/31/13 | 16576.66 |
| 12/30/13 | 16504.29 |
| 12/27/13 | 16478.41 |
| 12/26/13 | 16479.88 |
| 12/24/13 | 16357.55 |
It's pretty clear now that December 31 was the high. Why does it matter? Look at this chart:
Once a peak is reached, stocks decline fairly rapidly. They don't stick around at a permanently high level. The only question is how low will it go.
Gold is back

Gold is now higher than it was 6 months ago. I'm still baffled as to why it dropped, but those days are over. I think it will break $1300 within a few days.
Thursday, January 23, 2014
U.S. Debt is a Myth
This is an old video from 2011 from economist Mike Norman. He is a MMTer (Modern Monetary Theory, which is neo-Keynesianism). I can't say I disagree with him. That's why I have my own measure of money supply in which the government debt is included.
But I can't say that he is right. Let me try to explain. Let's imagine a very spoiled rich girl with a checkbook. She has the last name of say, Hilton, and a very wealthy very doting grandfather. And a coterie of followers who subscribe to her Twitter account and collect anything with her name on it. She obviously will have a different perspective on life than the average person. And let's say that she believes that she can create money out of thin air. All she has to do is write the numbers on the "magic" check and it will appear. The only caveat is that she only has so many checks. She's right. Whatever she creates, her followers will collect because it has her signature on it. They won't even take it to the bank. And if they do, her grandfather will make sure it is honored. Now supposed she developed a theory of economics. That's Mike Norman for you. It makes your brain hurt to listen to him. Ok, Mike you are right. So please shut up and go away, so I can watch a Peter Schiff video.
Wednesday, January 22, 2014
Netflix Meltup

Netflix closed at 333.73, up 5 for the day. Just 4 hours later, it jumped another 60.
Thrive - The Movie
This looks interesting. This is a trailer for a 2 hour movie which I haven't seen yet.
Monday, January 20, 2014
Catastrophic failure in China
Observers make the logical argument that “to have a market meltdown, you have to have a market” and China does not have one. Instead, Beijing technocrats dictate outcomes. That’s correct, but that is also why China is now heading to catastrophic failure. Because Chinese leaders have the power to prevent corrections, they do so. Because they do so, the underlying imbalances become larger. Because the underlying imbalances become larger, the inevitable corrections are severe. Downturns, which Beijing hates, are essential, allowing adjustments to be made while they are still relatively minor. The last year-on-year contraction in China’s gross domestic product, according to the official National Bureau of Statistics, occurred in 1976, the year Mao Zedong died.
Why will China’s next correction be historic in its severity? Because Chinese leaders will prevent adjustments until they no longer have the ability to do so. When they no longer have that ability, their system will simply fail. Then, there will be nothing they can do to prevent the freefall.
http://www.forbes.com/sites/gordonchang/2014/01/19/mega-default-in-china-scheduled-for-january-31/
Sunday, January 19, 2014
AUD-USD forecast
AUD-USD Research Report
Date 1/19/2014
Big Picture for the AUD
======================
The Australian economy is faltering. The RBA was trying to establish 3.0% as its benchmark cash rate, but it had to drop it to 2.75% in May 2013 and 2.5% in August, the lowest in history. It will probably be dropped another 25 basis points in March.
Australia's economy has largely been based on mining and commodities, but those industries are hurt by lower commodity prices and demand. It depends heavily on China, which is slowing down its growth. China no longer needs unlimited amounts of iron ore, copper and coal. Australia is trying to diversify its economy, but its non-mining economy is not growing fast enough to offset the decline in the mining economy.
Australia has very high real estate prices and may be in a bubble which is about to pop. The average home price in Sydney increased more than 13% in 2013 to more than A$700,00. Many suburbs of Sydney now have median prices above A$1 million. Average household debt as a percent of annual income is almost 150%, compared with 135% in the US. (http://www.bloomberg.com/news/2013-11-05/bubble-trouble-seen-brewing-in-australia-home-prices-mortgages.html). The lowered interest rates contributed to the high real estate prices, but now houses are very unaffordable and are near their peak even if interest rates drop even further.
The Great Recession of 2008-2009 never really affected Australia. It grew 2% in 2009 (while other countries were in a severe recession) because of its proximity to the booming Chinese economy and the related mining boom. Australia hasn't had a real estate crash (i.e. prices dropping by more than 10% in one year) in more than 40 years. The next recession will hit Australia hard.
In a panic, the Australian dollar can drop like a rock. It dropped 40% over a 3 month period in 2008. This helped their economy in AUD terms because it made them more competitive. But this fact doesn't help foreigners invested in AUD.
So obviously, none of this is helpful to the AUD. But here is the flip side of the argument. The AUD has already dropped about 16.4% over the last year. The weaker AUD helps their economy. And the charts look like a double bottom is in place. Another fact is that the AUD tracks the price of gold, with about a 1 month delay. And the bottom for gold is in and gold is starting to go higher. However, the price of gold isn't forecast to rise very much in 2014.
My conclusion is that the AUD is likely to drop further against the dollar, but it is near the bottom. The most likely level in 30 days would be near the bottom first reached on Aug 1, 2013 and then again on Dec 19. Say about 0.8850.
For a 1 year forecast, the AUD will also probably be close to where it is today, in the 0.88 to 0.89 range. However, if the RBA cuts the cash rate to 2.25% it will drop even lower, maybe down to 0.85.
Update: The AUD won't necessarily rise if the price of gold does. So look for a modest (3%) drop in AUD. Which would put it at about 0.8650 on 12/31, and if the cash rate is dropped again, down to 0.8300.
Short-Term Forecast
===================
The AUD closed on 1/17/14 at 0.8778. On 1/1/14 it was at 0.8915. There is support at 0.8728 and resistance at 0.8893. I think in the short run the trend will be flat or down slightly, so it is probably safer betting on a small downward slide. So short the AUD by selling it at 0.8880 and buying at 0.8740, a band of 140 pips. Or the reverse, although you would want to sell at a lower level, like 0.8850.
AUD and Gold


Similar drop and double bottom, although the change in the AUD seems to be about 1 month later. The big drop in gold was on Apr 15, and the AUD didn't drop until May. Gold had a high about Sept and the AUD had a short-term peak about October. So the little rise now may show up in the AUD in February.

Update: Don't forget this chart. The price of gold in AUD also dropped, but not as much as in USD because of the drop in AUD against the USD. And the recovery in the price of gold in late August didn't help the AUD at all. The recent spike in the gold price also shows up as a spike here. So a recovery in the gold price may not help the AUD.
AUDUSD trend

The AUDUSD has been in a downward trend until Jan. 7, 2014. It is unclear what happens next. Will the downward trend continue, has it bottomed out, will it go sideways. Just looking at this, it is too risky to trade until the trend is re-established.
GBPUSD trend

There was a long-term upward trend which was broken on Jan 14. It is unclear whether this is just a break in the upward trend which started on July 14, 2013 or a start of a new downward trend.
So I think it is too risky trade the pound until the long-term trend is re-established.
GBPUSD 30 day forecast
GBPUSD Research Report
Date 1/19/2014
This report is an attempt to make a 30-day forecast on the pound vs the dollar.
Big Picture for the USD
=======================
The US economy is booming.
+ Current-dollar GDP increased at a 6.2% annual rate in the 3rd quarter, and real GDP increased at a 4.1% annual rate, so that implies inflation of about 2.1%.
+ The US deficit is still high at $680 billion for FY 2013, but dropped $409 billion from the previous year. It is now only 4.1% of GDP.
+ The unemployment rate dropped to 6.7% in December from 7.0% in November. However, this is based partially on manipulating the size of the labor source, which keeps dropping. People whose long-term unemployment benefits have expired are no longer considered to be unemployed.
+ The stock market is booming, and the Dow was up 23.6% last year. There must be some foreign money coming into the market. It is flat in 2014, however. It should rise about 8-10% this year, with the next big crash coming in the fall of 2015, 7 years after the previous one.
+ The money supply (as measured by my M5 metric) increased only 3.5% in 2013, much lower than the stock market.
+ The price of gold dropped from about 1700/ounce to about 1200/ounce in 2013.
+ The Fed funds rate is still stuck in the zero to 0.25% range.
= All of this tends to show that the dollar strengthened considerably in 2013.
However, in the short-term, over the next 30 days, this trend seems to have stalled or reversed.
+ As mentioned, the stock market is flat in 2014, except for certain stocks (Merck, Visa).
+ The price of gold seems to have hit an absolute bottom of about 1200. It is now about 1250 and is on an upward trend. I expect this to continue for the next 30 days.
Big Picture for the GBP
======================
The British economy is booming.
+ It was in a triple-dip recession, but unemployment dropped to 7.6% in 3Q 2013, and this number is expected to decline to 7.0% by the end of 2014.
+ Annual sales are up 5.3% in December, the highest rate of growth since 2004.
+ The central bank is expected to hike rates in early 2015, ahead of the Fed. This will strengthen the pound, but this won't happen for a year.
+ London real estate prices are booming and increased about 9% in 2013 and are expected to increase another 8.5% in 2014. The mega rich from all over the world (Dubai, Russia, China, etc) invest in London real estate, seeing it as a sign of stability.
+ The British stock market (FTSE-100) increased about 12% in 2013. The boom is expected to continue in 2014, with the FTSE breaking 7500. This would be another 12% increase. It is up about 1% already in January.
+ The price of gold dropped from about 1050/ounce to about 725/ounce in 2013.
+ The benchmark interest rate in the UK remains at 0.5%.
+ The UK deficit is about 100 billion pounds/year (6.9% of GDP), and is on a downward slope.
= All of this tends to show that the pound strengthened in 2013.
The price of gold seems to have hit an absolute bottom of about 725/ounce and is now on an upward trend. It is currently at about 760. So this shows a short-term weakening.
But overall, the British economy was slower to recover than the US economy over the past several years. The US may be near a peak in its current economic cycle, but the British economy is expected to grow faster in 2014. So we could expect the pound to strengthen slightly (say 3%) against the dollar over the next 12 months.
Short-Term Forecast
===================
The GBP/USD closed on 1/17/2014 at 1.6442, and 1.6481 the previous week. There is resistance at 1.6475, 1.6500, 1.6600, 1.6705 and then heavy resistance at 1.6990.
Support is at 1.6343, 1.6247, 1.6125, 1.6000, and 1.5893.
It opened on 1/1/2014 at 1.6542 and dropped to 1.6340 on 1/16, before recovering.
One analyst [1], predicts a 3 month range of 1.60 to 1.67.
1. http://www.poundsterlingforecast.com/2014/01/09/onward-and-upward-for-the-pound-actual-rate-predictions-2014/
A reasonable 30 forecast (for 2/18/14) would be a level slightly higher than Jan 1, say about 1.6570, but below the 1.6600 resistance.
I would wait until it drops below 1.6360 to buy (above the 1.6340 support, which happened on Jan 16 and 17) and then sell above 1.6470 (right below the 1.6475 resistance, which happened on Jan 2 and Jan 13). This would provide a 110 pip window, with potential to go up another 100 points if the 1.6475 and 1.65 resistance is broken.
Friday, January 17, 2014
Visa meltup
Visa stock is up almost 4% for the day, from 222 to 232, on a strong earnings report. It is a prime candidate to be added to my G30 stock list, but I would like to see it go a little higher first. It has 636.74M shares outstanding, so a close above $235 would do it. Its at $232.18 at the moment.
 This chart doesn't even include today's activity.
The Death of the American Dream
Cute cartoon about how the Fed is killing the American Dream. I might have already posted it, but I don't think so. Watch it!
Thursday, January 16, 2014
Soda as a medium of exchange
"Once a month, the debit-card accounts of those receiving what we still call food stamps are credited with a few hundred dollars — about $500 for a family of four, on average — which are immediately converted into a unit of exchange, in this case cases of soda. On the day when accounts are credited, local establishments accepting EBT cards — and all across the Big White Ghetto, “We Accept Food Stamps” is the new E pluribus unum – are swamped with locals using their public benefits to buy cases and cases — reports put the number at 30 to 40 cases for some buyers — of soda. Those cases of soda then either go on to another retailer, who buys them at 50 cents on the dollar, in effect laundering those $500 in monthly benefits into $250 in cash — a considerably worse rate than your typical organized-crime money launderer offers — or else they go into the local black-market economy, where they can be used as currency in such ventures as the dealing of unauthorized prescription painkillers — by “pillbillies,” as they are known at the sympathetic establishments in Florida that do so much business with Kentucky and West Virginia that the relevant interstate bus service is nicknamed the “OxyContin Express.” A woman who is intimately familiar with the local drug economy suggests that the exchange rate between sexual favors and cases of pop — some dealers will accept either — is about 1:1, meaning that the value of a woman in the local prescription-drug economy is about $12.99 at Walmart prices.
It’s possible that a great many cans of soda used as currency go a long time without ever being cracked — in a town this small, those selling soda to EBT users and those buying it back at half price are bound to be some of the same people, the soda merely changing hands ceremonially to mark the real exchange of value, pillbilly wampum."
http://www.nationalreview.com/article/367903/white-ghetto-kevin-d-williamson/page/0/1
The coming meltdown in Singapore
See http://globaleconomicanalysis.blogspot.com/2014/01/singapore-set-for-icelandic-style.html
http://stratrisks.com/geostrat/17491
"As one of the 25 financial centers that the IMF regards as systemically important, a financial crisis centered in Singapore would put the entire global financial system in jeopardy.... Singapore currently has the highest number of millionaires per capita in the entire world ... It is important to be aware that Singapore’s bubble economy may continue inflating for several more years if the U.S. Fed Funds Rate and SIBOR continue to be held at such low levels ... I expect the ultimate popping of the emerging markets bubble to cause another crisis that is similar (though not identical in every technical sense) to the 1997 Asian Financial Crisis, and there is a strong chance that it will be even worse this time due to the fact that more countries are involved (Latin America, China, and Africa), and because the global economy is in a much weaker state now than it was during the booming late-1990s."
So when will this occur? When interest rates start to rise. I am horrible at predictions, but a crash in the fall of 2015 sounds about right.
Tuesday, January 14, 2014
Black Tuesday
The Wall Street Crash of ______, also known as Black Tuesday or the Stock Market Crash of ______, began in _____________ and was the most devastating stock market crash in the history of the United States, when taking into consideration the full extent and duration of its fallout. The crash signaled the beginning of the 10-year Great Depression that affected all Western industrialized countries.
The Roaring ________, the decade that followed __________ and led to the Crash, was a time of wealth and excess. Building on post-war optimism, many rural Americans migrated to the cities in vast numbers throughout the decade with the hopes of finding a more prosperous life in the ever growing expansion of America's industrial sector. While the American cities prospered, the vast migration from rural areas and continued neglect of the US agriculture industry would create widespread financial despair among American farmers throughout the decade and would later be blamed as one of the key factors that led to the ____ stock market crash.
Despite the dangers of speculation, many believed that the stock market would continue to rise indefinitely. On ___________, however, a mini crash occurred after investors started to sell stocks at a rapid pace, exposing the market's shaky foundation. Two days later, banker ________ announced his company the __________ Bank would provide $_________ in credit to stop the market’s slide. ________'s move brought a temporary halt to the financial crisis and call money declined from ___ to ____ percent. However, the American economy was now showing ominous signs of trouble. Steel production was declining, construction was sluggish, car sales were down, and consumers were building up high debts because of easy credit.
Denial is not just a river in Egypt
"GOLDMAN: Here Are 4 Reasons Why You Can't Say The Stock Market Is A Bubble
Valuations are not in bubble territory. "While valuations are quite expensive and certainly imply lower returns over the next five years, normalization of valuations over time does not imply “implosion” or even negative annual returns. Furthermore, our economic outlook supports our moderate earnings-per- share growth expectation of approximately 6% for 2014. Therefore, based on our view of a reasonable set of assumptions, equity valuations have not deviated from intrinsic value significantly enough to be in bubble territory."
Read more: http://www.businessinsider.com/goldman-why-stocks-are-not-in-a-bubble-2014-1
RICH BERNSTEIN: There Is No Equity Bubble Equity Bubble? No. A growing contingent of market observers is fearful that the US equity market is in some sort of a bubble. We disagree completely with this notion. A strong market rally that many investors have missed is hardly sufficient grounds for a financial bubble. ... While there is no doubt that investors’ fears regarding equities after the 2008 bear market have started to subside, this is a normal occurrence for a mid-cycle environment. The euphoria that is typically present at market peaks has yet to occur.
Read more: http://www.businessinsider.com/rich-bernstein-no-equity-bubble-2014-1
G30 Revised Again
This is my blog and I can post what I want to. I have my own list of stocks that I like better than the fabled Dow Jones Industrial Average, which has 30 stocks. Well, I like the number 30 too. I just added Merck to my list of "G30" stocks, based on its performance yesterday. I was going to go with 31 stocks on my list, but that kind of breaks the elegance.
So I am kicking Toyota off my list. Not because it is a foreign company. It isn't, its an international company. It has 6 manufacturing plants in the US and employs tens of thousands of workers here.
But because it is out of sync with the rest of the stocks. Every single stock on the list went up between 9/30 and 12/31, most by more than 10%. Except Toyota, which went down 5%. It lacks what I call "bubbleosity", which is the tendency to develop a bubble with the rest of the market.
So here are the revised, revised numbers. This is the same as my Global 30 Index which I posted earlier, with the addition of Merck and the deletion of Toyota.
So it is up 11.4% during that period.
So I am kicking Toyota off my list. Not because it is a foreign company. It isn't, its an international company. It has 6 manufacturing plants in the US and employs tens of thousands of workers here.
But because it is out of sync with the rest of the stocks. Every single stock on the list went up between 9/30 and 12/31, most by more than 10%. Except Toyota, which went down 5%. It lacks what I call "bubbleosity", which is the tendency to develop a bubble with the rest of the market.
So here are the revised, revised numbers. This is the same as my Global 30 Index which I posted earlier, with the addition of Merck and the deletion of Toyota.
| Total (M) | Total (M) | ||||||
| 09/30/13 | 12/31/13 | ||||||
| Adjusted Total | 6,154,645 | 6,857,198 |
So it is up 11.4% during that period.
Monday, January 13, 2014
Will the stock market crash tomorrow?

It was predicted in November that the stock market would crash on Jan 14, 2014. Here we are. The Dow dropped by 179 points today. Is it going to crash tomorrow?
Merck goes wild
Merck just got approval for a new drug from the FDA and its stock goes wild (up 6.5%). This puts its market cap over $150 billion. So I am going to add it my Global 30 list, which now has 31 stocks on it. Here is the info for Merck.
Stock Symbol: MRK
Headquarters City: Whitehouse Station, NJ (pop. 2,089)
Shares Outstanding: 2920M
Stock Price 9/30/2013: $47.18
Market Cap 9/30/2013: 137,766
Stock Price 12/31/2013: $50.05
Market Cap 12/310/2013: 146,146
Stock Price 1/13/2014: $53.12
Market Cap 1/13/2014: 155,110
Stock Symbol: MRK
Headquarters City: Whitehouse Station, NJ (pop. 2,089)
Shares Outstanding: 2920M
Stock Price 9/30/2013: $47.18
Market Cap 9/30/2013: 137,766
Stock Price 12/31/2013: $50.05
Market Cap 12/310/2013: 146,146
Stock Price 1/13/2014: $53.12
Market Cap 1/13/2014: 155,110
Govt runs $44 billion surplus in December; Natl Dept up $135 billion
Revenues are up 5% over December 2012 and outlays are down 10%.
See http://www.cbo.gov/publication/44999.
So this means the national debt dropped in December, right? Wrong. The total national debt was $17.217 trillion on 11/30/13 and $17.352 trillion on 12/31/13. How is this possible? Some sort of trickery, smoke and mirrors.
Update: The national debt jumped $125 billion on Dec. 31 from the 30th. So that's a big part of it. But why did it jump? Intragovernmental holdings, as part of this 1 day increase, jumped by $79 billion. But why? Doesn't that money represent tax money that came in from Social Security or related trust funds that was spent by the general fund? So how was it spent if there is a surplus?
The Daily Treasury Report for 12/31 shows Cash on deposit with the Fed of $162 billion vs. $33 billion at the beginning of the month. That's a $129 bn increase. But we are still missing about $50 bn or so. The cash increased by $95 bn on 12/31 but the national debt increased by $125 bn on that date. That's a $30 bn difference. What happened? Did Moochelle go on a shopping spree? (joke)
Obamacare will cost $1 trillion to bailout insurance companies
"Insurance companies won’t bear the cost of their own losses—at least not more than about a quarter of them. The other three-quarters will be borne by American taxpayers. For some reason, President Obama hasn’t talked about this particular feature of his signature legislation. Indeed, it’s bad enough that Obamacare is projected by the Congressional Budget Office to funnel $1,071,000,000,000.00 (that’s $1.071 trillion) over the next decade (2014 to 2023) from American taxpayers, through Washington, to health insurance companies. It’s even worse that Obamacare is trying to coerce Americans into buying those same insurers’ product (although there are escape routes). It’s almost unbelievable that it will also subsidize those same insurers’ losses." http://www.weeklystandard.com/blogs/bailing-out-health-insurers-and-helping-obamacare_774167.html
Obamacare is a total fraud. It is designed to fail. The real purpose is to coerce patients to be a part of it, and to coerce insurance companies and doctors to support it. Then replace it with a "single-payer" system. It is one step in the planned government takeover of 1/6th of the economy.
Obamacare is a total fraud. It is designed to fail. The real purpose is to coerce patients to be a part of it, and to coerce insurance companies and doctors to support it. Then replace it with a "single-payer" system. It is one step in the planned government takeover of 1/6th of the economy.
Top US cities for growth
- Austin, TX
- Provo-Orem, UT
- San Francisco, CA
- San Jose-Sunnyvale-Santa Clara, CA
- Salt Lake City, UT
- Seattle, WA
- Dallas, TX
- Houston, TX
- Boulder, CO
- Greeley, CO
- Charleston, SC
- San Antonio, TX
- Raleigh-Cary, NC
- Nashville, TN
- Denver-Aurora, CO
- Ft. Worth, TX
- Corpus Christi, TX
- Trenton-Ewing, NJ
- Bakersfield, CA
- Ft. Collins-Loveland, CO
- Portland, OR
- Laredo, TX
- Cambridge, MA
- Lafayette, LA
- San Luis Obispo, CA
- Ogden, UT
- Charlotte, NC
- Oklahoma City, OK
- Minneapolis-St Paul, MN
- Des Moines, IA
Saturday, January 11, 2014
HQ #8 - Walmart
Nothing too exciting, but it was interesting seeing the British guys. Walmart has more than 2 million employees worldwide in more than 11,000 locations, and has sales of more than $400 billion/year. It is all run from tiny Bentonville, Arkansas, population 38,000.
Porsche Design Tower
In Sunny Isles Beach, Florida. Your garage is on the same floor as your apartment. The building has 3 car elevators. Twenty-two billionaires have already bought units. The project will be completed in 2016.
See also http://www.porsche-design.com/en/News/Porsche-Design-Tower/
http://www.dailymail.co.uk/news/article-2537136/Billionaires-playground-650ft-The-60-storey-Porsche-Design-Tower-Miami-shorefront-complete-three-car-elevators-movie-theatre-spa-plunge-pools-balcony.html
http://www.theatlanticcities.com/housing/2013/12/miamis-newest-condo-tower-will-be-home-nearly-2-percent-worlds-billionaires/7804/
Questions:
What if the elevator breaks down?
What if some idiot or crazy suicidal ex-girlfriend tries to drive the car out the window?
What if the building is hit by a 200 MPH hevel 5 hurricane? Will all the glass survive a direct hit?
Revised Global 30 List
This is my revised list of what I call the Global 30 stocks. This is the same list that I previously posted, except I removed PetroChina and China Mobile, because these are controlled by their parent companies, which are owned by the government of China.
There are only 8 foreign companies left on the list - Royal Dutch Shell, HSBC Holdings, Novartis, Toyota, Vodafone, BHP Billiton, Anheuser-Busch and BP. I am including only companies listed on the NYSE, so that they are "Americanized" to some degree, and regulated. Samsung isn't included because it isn't listed on the NYSE.
They all went up in value except Toyota.
I think that the stock of these companies are equivalent to money, and the increase in value is mostly due to QE, not fundamentals.
=================
Update:
I'm still playing with this concept. I've decided to add Merck, giving this a total of 31 stocks, so the numbers now look like this:
There are only 8 foreign companies left on the list - Royal Dutch Shell, HSBC Holdings, Novartis, Toyota, Vodafone, BHP Billiton, Anheuser-Busch and BP. I am including only companies listed on the NYSE, so that they are "Americanized" to some degree, and regulated. Samsung isn't included because it isn't listed on the NYSE.
They all went up in value except Toyota.
| Price | Price | Total (M) | Total (M) | |||
| Symbol | Company | Shares (M) | 09/30/13 | 12/31/13 | 09/30/13 | 12/31/13 |
| AAPL | Apple Inc | 899.7 | 473.98 | 561.02 | 426,440 | 504,750 |
| XOM | Exxon Mobil | 4370 | 85.46 | 100.60 | 373,460 | 439,622 |
| GOOG | 334.09 | 875.91 | 1120.71 | 292,633 | 374,418 | |
| MSFT | Microsoft | 8350 | 33.03 | 37.41 | 275,801 | 312,374 |
| BRK-A | Berkshire Hath | 1.65 | 170,410 | 177,900 | 281,177 | 293,535 |
| GE | General Electric | 10120 | 23.70 | 28.03 | 239,844 | 283,664 |
| JNJ | Johnson Johnson | 2820 | 86.09 | 91.59 | 242,774 | 258,284 |
| WMT | Wal-Mart | 3240 | 73.53 | 78.69 | 238,237 | 254,956 |
| CVX | Chevron | 1920 | 120.49 | 124.91 | 231,341 | 239,827 |
| WFC | Wells Fargo | 5270 | 41.03 | 45.40 | 216,228 | 239,258 |
| RDS-B | Royal Dutch Shell | 3140 | 67.95 | 75.11 | 213,363 | 235,845 |
| PG | Proctor Gamble | 2720 | 75.00 | 81.41 | 204,000 | 221,435 |
| HSBC | HSBC Holdings | 4000 | 53.78 | 55.13 | 215,120 | 220,520 |
| JPM | JP Morgan Chase | 3760 | 50.65 | 58.48 | 190,444 | 219,885 |
| IBM | IBM | 1090 | 184.19 | 187.57 | 200,767 | 204,451 |
| PFE | Pfizer | 6480 | 28.51 | 30.63 | 184,745 | 198,482 |
| NVS | Novartis | 2440 | 76.71 | 80.38 | 187,172 | 196,127 |
| TM | Toyota Motor Co | 1580 | 128.03 | 121.92 | 202,287 | 192,634 |
| VOD | Vodafone | 4860 | 34.65 | 39.31 | 168,399 | 191,047 |
| T | ATT | 5270 | 33.37 | 35.16 | 175,860 | 185,293 |
| KO | Coca Cola | 4420 | 37.62 | 41.31 | 166,280 | 182,590 |
| AMZN | Amazon | 457.7 | 312.64 | 398.79 | 143,095 | 182,526 |
| BHP | BHP Billiton Ltd | 2660 | 66.50 | 68.20 | 176,890 | 181,412 |
| ORCL | Oracle | 4540 | 32.95 | 38.26 | 149,593 | 173,700 |
| BUD | Anheuser-Busch | 1600 | 98.42 | 106.46 | 157,472 | 170,336 |
| BAC | Bank of America | 10670 | 13.79 | 15.57 | 147,139 | 166,132 |
| C | Citigroup | 3030 | 48.50 | 52.11 | 146,955 | 157,893 |
| BP | BP plc | 3140 | 41.52 | 48.61 | 130,373 | 152,635 |
| CMCSA | Comcast | 2620 | 45.12 | 51.97 | 118,214 | 136,161 |
| FB | 2450 | 50.23 | 54.65 | 123,064 | 133,893 | |
| Total | 6,219,167 | 6,903,685 |
I think that the stock of these companies are equivalent to money, and the increase in value is mostly due to QE, not fundamentals.
=================
Update:
I'm still playing with this concept. I've decided to add Merck, giving this a total of 31 stocks, so the numbers now look like this:
| MRK | Merck | 2920 | 47.18 | 50.05 | 137,766 | 146,146 |
| Adjusted Total | 6,356,933 | 7,049,831 |
China Mobile
China Mobile is of the largest companies in the world, which is why I had it in my list of Global 30 companies I am watching. I don't want to "discriminate" against non-US companies, especially those who have taken the time and energy to get listed on the NYSE. However, there are some things about the company I am not comfortable with.
"The Company's majority shareholder is China Mobile (Hong Kong) Group Limited ("CMHK (Group)"), which, as of 31 December 2012, indirectly held an equity interest of approximately 74.08% in the Company through a whollyowned subsidiary, China Mobile Hong Kong (BVI) Limited ("CMHK (BVI)"). The remaining equity interest of approximately 25.92% of the Company was held by public investors. ... Section 303A.01 of the NYSE Listed Company Manual provides that listed companies must have a majority of independent directors. As a listed company in Hong Kong, the Company is subject to the requirement under the Hong Kong Listing Rules that at least one-third of its board be independent non-executive directors as determined under the Hong Kong Listing Rules. The Company has 3 independent non-executive directors out of a total of 9 directors. The Hong Kong Listing Rules set forth standards for establishing independence, which differ from those set forth in the NYSE Listed Company Manual."
http://www.chinamobileltd.com/en/about/cg.php
==================================
So, who to replace it with? I like the number 30, and there are 30 companies in the DJIA. I'm going with Comcast (CMCSA), which is another bubblicious stock like Facebook.
The Interlace, Singapore
The Interlace looks like a bunch of blocks stacked on each other randomly.
.jpg)
However, there is a method to the madness. They are stacked around hexagonal courtyards.
.jpg)
"The interlocking blocks create a vertical village of both shared and private outdoor spaces on multiple levels. While maintaining the privacy of the individual apartments through the generous spacing of the building blocks, The Interlace creates an interactive network of outdoor spaces oriented around the focal points of the courtyards, reflecting and extending the natural surroundings."
See: http://afasiaarq.blogspot.com/2013/10/oma-scheeren.html
However, there is a method to the madness. They are stacked around hexagonal courtyards.
"The interlocking blocks create a vertical village of both shared and private outdoor spaces on multiple levels. While maintaining the privacy of the individual apartments through the generous spacing of the building blocks, The Interlace creates an interactive network of outdoor spaces oriented around the focal points of the courtyards, reflecting and extending the natural surroundings."
See: http://afasiaarq.blogspot.com/2013/10/oma-scheeren.html
HQ #7 - Johnson Johnson
I don't use the ampersand because blogger screws it up.
 Johnson Johnson Headquarters in New Brunswick, New Jersey. They are listed on the stock exchange in New York, New York. Its Australian office is in New South Wales. They own Neutrogena.
JNJ has about 250 subsidiaries.
JNJ has about 250 subsidiaries.
Friday, January 10, 2014
HQ #6 - General Electric

GE's global HQ is 2 3-story buildings, one that looks like a zero from the sky and the other that looks an eight. Also the guesthouse that looks like a squashed pyramid. This is set in a wooded area of Fairfield, Connecticut. GE is a conglomeration of numerous smaller businesses, some of which would be on the Fortune 500 list by themselves if they were spun off.
From this tiny headquarters it controls a world-wide empire.
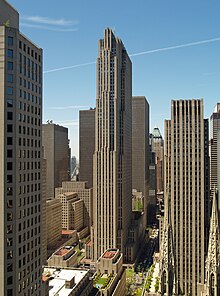
The GE Building in New York, also known as "30 Rock". It was known as the RCA building until 1988. It is the headquarters for NBC. GE no longer owns NBC, having sold its remaining shares to Comcast in 2013. (NBC owns the "NBC Tower" in Chicago which is similar to the GE Building).
This is a 1950s documentary on automation.
Thursday, January 9, 2014
HQ #5 - Berkshire Hathaway
Buffet rents the 14th floor of a nondescript office building in Omaha, NE, where he and 20 employees run a business empire worth almost $300 billion. He doesn't have a computer on his desk. This shows him playing cards with Bill Gates.
M6 as of 12/31/13
| M6 as of 12/31/13 | |
| M2 | 10,990.3 |
| Public Debt | 12,355.4 |
| Less Fed-owned Treasuries | -2,208.8 |
| Global 30 Market Cap | 6,977.7 |
| 28,114.6 |
This is 3.7% higher than the total of 27,108.0 on 9/30/2013. The biggest increase came from stocks.
=====================
The G30 as of 12/31/13 was subsequently revised to 6,857.2 with the addition of Merck and removal of Toyota. That makes the M6 total 27,994.1, which is 3.9% higher than the total of 26,934.8 on 9/30/13.
=====================
The G30 as of 12/31/13 was subsequently revised to 6,857.2 with the addition of Merck and removal of Toyota. That makes the M6 total 27,994.1, which is 3.9% higher than the total of 26,934.8 on 9/30/13.
PetroChina vs FaceBook
"PetroChina was established on November 5, 1999 with CNPC as its sole promoter. As of December 31, 2007, CNPC owned 157,922,077,818 shares, representing approximately 86.29% of the share capital of PetroChina, and, accordingly, CNPC is our controlling shareholder. ... CNPC’s interests may sometimes conflict with those of some or all of our minority shareholders. We cannot assure you that CNPC, as controlling shareholder, will always vote its shares in a way that benefits our minority shareholders." Source: PetroChina's SEC Filing
This isn't a stock for widows or orphans. I'm removing it from my Global 30 list. If I was a billionaire like Warren Buffet, I wouldn't invest a dime in this company. Ownership of stock in PTR would be more like owning a bond. And maybe they mean well, but in a financial crisis, you would be the last to be paid back. I'm replacing it with another company.
============================
FaceBook now has a market cap of over $140 billion, which is absurd. But I think it is indicative of our bubble economy.
The Global 30 is my version of the fabled Dow Jones Industrial Average. I'm adding FaceBook to it. See previous posts, which I will edit.
Other possible candidates were Verizon (VZ), Merck (MRK), PhilipMorris (PM), and GlaxoSmithKline (GSK). And Comcast (CMCSA). FaceBook stock is increasing faster than these companies, and it will probably drop faster in a crash, which is exactly what I want to show.
I wonder when FaceBook will be added to the DJIA? (joke)
Subscribe to:
Posts (Atom)