I think we may be seeing a "run" on yield. And maybe what looks like QE from the Fed is them jumping in and buying the "cheap" bonds. I think there is a chance that the 30-year may drop to 1% or even lower. When will this happen if current trends continue?
Lets look at the history of the 30-year yield from the Treasury Dept.
3.0% 3/19/19
2.9% 5/6/19
2.8% 5/22/19
2.7% 5/28/19
2.6% 7/25/19
2.5% 7/31/19
2.4% 8/1/19
2.3% 8/5/19
2.2% 8/9/19
2.1% 8/22/19
2.0% 8/26/19
1.9% 9/6/19 (projected)
1.8% 9/20/19 (projected)
1.7% 10/4/19 (projected)
1.6% 10/18/19 (projected)
1.5% 11/1/19 (projected)
1.4% 11/15/19 (projected)
1.3% 11/29/19 (projected)
1.2% 12/13/19 (projected)
1.1% 12/27/19 (projected)
1.0% 1/10/20 (projected)
Now, I certainly hope this doesn't happen, but it looks like a slow-motion collapse of the entire economic system is happening right now. If true, when did it start? I think it started on July 31 when the Fed cut short-term rates to 2.1%. You would think that cutting rates would help head off a recession, but in this case the rate cut started the slow-motion collapse. Because when rates are cut once, you know they will be cut again and again and again (and again). And investors have to snap up the yield while the getting is good.
Friday, August 30, 2019
US Treasuries are Veblen goods
 |
| Thorstein Veblen, 1857-1929 |
Read: The high price of dollar safety
When the Fed tightens, the bond markets infer that a reduction in the supply of safe dollar assets is imminent. As a result of this supply shift, the marginal willingness of global investors to pay for the safety and liquidity of dollar-denominated assets - as measured by the convenience yield on these assets - increases, leading to an appreciation of the dollar in response to this increase in the convenience yield (even when controlling for interest rates). This is similar to how “Veblen goods" behave. Normally, when the price of a good rises, demand for it falls away until the price stabilises. But with Veblen goods, the opposite happens: rising prices feed demand. Veblen goods are typically luxury items to which (rich) investors are attracted because of their scarcity: making them even more scarce raises demand. So it seems DDSAs are luxury financial assets for which investors fiercely compete. And US Treasuries are the most luxurious of all.
What is a Veblen good? Veblen goods are named after American economist Thorstein Veblen, who first identified conspicuous consumption as a mode of status-seeking in The Theory of the Leisure Class (1899).
If you look at the Daily Treasury Yield Curve, you can see that the yields on US Treasuries drop all along the curve, except for at the short end. The yield on the 30-year has dropped from 2.44% to 1.96% just this month. You may think that this doesn't make any sense. Don't investors want higher yield? And the answer is NO, they don't want higher yield; instead, they want safety. And because the price of a bond is inverse to its yield, the price, and what they could sell it for, keeps going up, so they get a return on investment that way. It's kind of like a bubble - since the price goes up, money keeps flowing into it. And this is money from all over the world. And since yields elsewhere are so low, the flow of money will continue, and the yields should continue to drop, and thus the price should continue to increase. And ironically, since the yield drops and the return drops, the return of dollars will become scarcer and dollars will become more valuable. Will this continue until the return on the 30-year drops to zero (or even below)? Maybe, because this has happened in other countries.
How do you fix this situation? Well, the Fed is engaging in QE again, but this doesn't help because this sucks up the Treasury bonds. It's not dollars themselves that are Veblen goods, but specifically US Treasuries. I think the only solution is to increase the supply. The Fed should start selling off its supply of Treasuries, especially at the longer end. Yes this will suck money out of the system, and specifically the stock market, but it will increase the supply of Treasuries, causing the price to drop and the yield to increase back to a more normal level.
The other way is for the US Treasury to sell more bonds, even if it doesn't need the cash. If they can repress the urge to spend it on stupid stuff, they could amass a war chest of trillions, which they could invest in gold and other assets like foreign currencies, maybe the Hong Kong dollar and Swiss franc. And maybe this would be currency manipulation, but all is fair in a trade war. And how about this? How about investing in the housing market, buying up tax liens (and forgiving them in certain cases), and buying up foreclosed properties and default debt (and forgiving the mortgages in certain cases). I'm sure it would be fun to brainstorm ways to invest trillions of dollars. The point is that the Treasury could increase the supply. But until the supply increases one way or another, the bizarre situation we are in will continue.
Thursday, August 29, 2019
The secret Supreme Court
There is the regular Supreme Court, and then there is a secret Supreme Court that makes secret laws and hears disagreements about the secret laws and makes binding decisions to resolve the disputes. This secret Supreme Court is called the Office of Legal Counsel (OLC).
The OLC has accumulated, over the years, a body of legal opinions that have the force and effect of law but whose very existence is concealed from the public. It’s impossible to estimate the size of this hidden corpus, but it’s perhaps useful to note that a case litigated by the ACLU two years ago uncovered, more-or-less by accident, the existence of almost a dozen OLC opinions whose existence the OLC had not previously acknowledged.
Within the executive branch, the OLC’s opinions are accorded essentially the same status as opinions of the U.S. Supreme Court. The OLC is “frequently asked to opine on issues of first impression that are unlikely to be resolved by the courts—a circumstance in which OLC’s advice may effectively be the final word on the controlling law.” In litigation, the OLC describes its final opinions as advisory, but in fact it views these opinions as binding on federal agencies, and this is how the agencies view them, too. Many OLC opinions are better characterized as law than as legal advice.
The OLC has published some of its written opinions and they are available here:
https://www.justice.gov/olc/opinions-volume
See also "The New Era of Secret Law".
Turning the tables
Mueller spent two years investigating President Trump. One of the charges was that he committed obstruction of justice by firing FBI Director James Comey. Now Comey is under investigation for leaking classified information. See
Report of Investigation of Former Federal Bureau of Investigation Director James Comey's Disclosure of Sensitive Investigative Information and Handling of Certain Memoranda
I don't have time to read it, but here is part of the introduction:
Between January 6, 2017, and April 11, 2017, while Comey was Director of the FBI, he memorialized seven one-on-one interactions that he had with President-elect and President Donald J. Trump. In June 2017, following Comey’s removal as FBI Director, the FBI reviewed the Memos to determine if any of the Memos contained classified information. The FBI determined that Memos 1 and 3 contained information classified at the “SECRET” level, and that Memos 2 and 7 contained small amounts of information classified at the “CONFIDENTIAL” level.
And here is part of the conclusion:
Comey had several other lawful options available to him to advocate for the appointment of a Special Counsel, which he told us was his goal in making the disclosure. What was not permitted was the unauthorized disclosure of sensitive investigative information, obtained during the course of FBI employment, in order to achieve a personally desired outcome.
Wednesday, August 28, 2019
$1 Trillion Debt Increase
On what day is the national debt consistently $1 trillion more that it was on the same date the prior year? I think we just passed it. It is possible that the debt increase will slow a little bit, but I think that from this day forward, the debt on any given day will be at least $1 trillion more than it was the prior year.
Look at this chart
So from 8/22/19 onward, the national debt is at least $1 trillion more than the prior year. It actually will increase more than this, but this is the minimum increase.
Fun fact: when did the national debt first exceed $1 trillion? The answer is Oct 22, 1981.
When is the national debt projected to exceed $30 trillion? I am assuming that the intragovernmental portion will reach $6 trillion and stay there. So this is the same as asking when the Debt Held By the Public will reach $24 trillion.
Some various answers are: 2026 and 2024.
Look at this chart
| National Debt | |||
| Date | National Debt | Last Year | Increase |
| 08/21/19 | 22,414,598,129,671.70 | 21,419,489,702,413.30 | 995,108,427,258.44 |
| 08/22/19 | 22,430,652,209,581.70 | 21,406,769,129,269.30 | 1,023,883,080,312.43 |
So from 8/22/19 onward, the national debt is at least $1 trillion more than the prior year. It actually will increase more than this, but this is the minimum increase.
Fun fact: when did the national debt first exceed $1 trillion? The answer is Oct 22, 1981.
When is the national debt projected to exceed $30 trillion? I am assuming that the intragovernmental portion will reach $6 trillion and stay there. So this is the same as asking when the Debt Held By the Public will reach $24 trillion.
Some various answers are: 2026 and 2024.
Monday, August 26, 2019
100 year Treasury bonds
See https://johnhcochrane.blogspot.com/2019/08/why-stop-at-100-case-for-perpetuities.html
and https://www.treasury.gov/resource-center/data-chart-center/quarterly-refunding/Pages/Latest.aspx
and https://www.treasury.gov/resource-center/data-chart-center/quarterly-refunding/Pages/Latest.aspx
Note Regarding Outreach Efforts
As part of an ongoing and periodic review of potential products that the U.S. Treasury Department might consider issuing, Treasury’s Office of Debt Management is conducting broad outreach to refresh its understanding of market appetite for a potential Treasury ultra-long bond (50- or 100-year bonds). No decision regarding whether to issue such a product has been made. Treasury conducted similar outreach on this product in 2017, and wants to update its market intelligence.
The Bank of England issued Consol bonds from 1751 to 1927. They were finally fully redeemed in 2015.
I think there would be an appetite for 50-year bonds, but they should hold off on the 100-year bonds.
Friday, August 23, 2019
The Beatles turn socialist
Does adulthood dismay you
vote me and I'll pay you
you won't have to grow up it's true.
All your bills will be paid
your adulthood delayed
and I'll give all this money to you.
Alternative Fiscal Scenario
Here is yet another 30 year forecast from the CBO. The source is here:
https://www.cbo.gov/system/files/2019-07/51119-CBO-2019-06-ltbo.xlsx
This was done in June so it doesn't take into account the newest increases in the budget. This would hit 150% of GDP in 2051.
https://www.cbo.gov/system/files/2019-07/51119-CBO-2019-06-ltbo.xlsx
This was done in June so it doesn't take into account the newest increases in the budget. This would hit 150% of GDP in 2051.
| Nominal | Debt Held By | Debt Held | |
| Year | GDP | Public Percent | By Public |
| 2019 | 21,300 | 78.00% | 16,614 |
| 2020 | 22,100 | 79.00% | 17,459 |
| 2021 | 22,900 | 81.00% | 18,549 |
| 2022 | 23,800 | 83.00% | 19,754 |
| 2023 | 24,700 | 85.00% | 20,995 |
| 2024 | 25,600 | 86.00% | 22,016 |
| 2025 | 26,700 | 87.00% | 23,229 |
| 2026 | 27,700 | 88.00% | 24,376 |
| 2027 | 28,700 | 89.00% | 25,543 |
| 2028 | 29,900 | 91.00% | 27,209 |
| 2029 | 31,000 | 92.00% | 28,520 |
| 2030 | 32,200 | 93.00% | 29,946 |
| 2031 | 33,500 | 95.00% | 31,825 |
| 2032 | 34,800 | 97.00% | 33,756 |
| 2033 | 36,100 | 99.00% | 35,739 |
| 2034 | 37,500 | 101.00% | 37,875 |
| 2035 | 38,900 | 103.00% | 40,067 |
| 2036 | 40,400 | 105.00% | 42,420 |
| 2037 | 41,900 | 108.00% | 45,252 |
| 2038 | 43,600 | 110.00% | 47,960 |
| 2039 | 45,200 | 113.00% | 51,076 |
| 2040 | 47,000 | 116.00% | 54,520 |
| 2041 | 48,800 | 119.00% | 58,072 |
| 2042 | 50,700 | 122.00% | 61,854 |
| 2043 | 52,700 | 125.00% | 65,875 |
| 2044 | 54,800 | 128.00% | 70,144 |
| 2045 | 56,900 | 131.00% | 74,539 |
| 2046 | 59,200 | 134.00% | 79,328 |
| 2047 | 61,500 | 137.00% | 84,255 |
| 2048 | 64,000 | 141.00% | 90,240 |
| 2049 | 66,500 | 144.00% | 95,760 |
Update: Notice that this has an odd "dip" in 2029. The increase in debt held by the public from 2027 to 2028 is 1,666 but the increase from 2028 to 2029 is only 1,311. This doesn't make any sense. Maybe there is some tax cut that expires in 10 years, leading to an increase in tax revenue in 2029.
Thursday, August 22, 2019
CBO updates its 10-year projection
Read: An Update to the Budget and Economic Outlook: 2019 to 2029
CBO’s estimate of the deficit for 2019 is now $63 billion more—and its projection of the cumulative deficit over the 2020–2029 period, $809 billion more—than it was in May 2019. The agency’s baseline projections of primary deficits (that is, deficits excluding net outlays for interest) for that period increased by a total of $1.9 trillion. Recently enacted legislation accounts for most of that change. Partly offsetting the increase in projected primary deficits is a net reduction of $1.1 trillion in the agency’s projections of interest costs over that same period.
So, I could do another long-term projection based on these numbers. But I don't have time right now. Let's jump to the bottom line.
My latest projections show that in 2029 debt held by the public will be 30,185 and GDP will be 32,000 for a ratio of debt to GDP of 94.3%. What does this projection show in 2029?
This report has debt held by the public in 2029 as 29,322. And GDP as 30,847. For a ratio of 95.1%. So the ratio is almost the same.
For some reason they show the 2029 deficit as about $100 billion less than the 2028 deficit. Because tax revenues will soar between 2028 and 2029, while outlays will increase at a much lesser rate. This seems highly unlikely to me.
It also assumes that there won't be any recession in the next 10 years.
Anyways it is better than their previous projection.
Wednesday, August 21, 2019
$44 Trillion in Debt by 2029
The National Debt is currently about $22 trillion. It will double, to $44 trillion in the next 10 years. See this chart from John Maudlin:
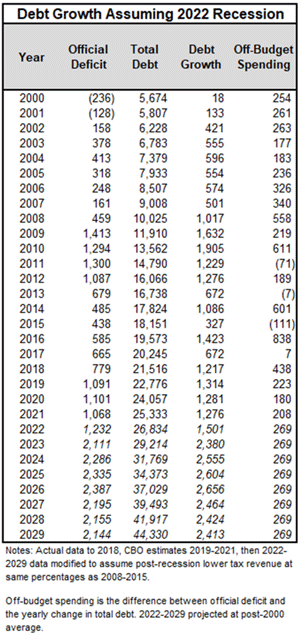
Source: https://www.mauldineconomics.com/frontlinethoughts/ray-dalio-john-mauldin-discussion-part-4
This assumes that there will be a recession starting in 2022. If the recession starts in 2020, then this number will be $2 trillion higher.
My own personal forecast was for debt held by the public to be about $30 trillion in 2029. We can assume another $5 trillion of intragovernmental debt, for a total of $35 trillion. So John Maudlin, is much more pessimistic than me.
Sunday, August 18, 2019
$500 Billion debt benchmark
At what point was the national debt consistently $500 billion higher than it was on the same date the previous year? I think it was sometime in the range 2013 to 2017. Lets find out.
The answer is 11/3/15. On this day the national debt was $18.532 trillion. One year prior, on 11/3/14, the debt was $17.908 trillion. The difference is $610 billion. Ever since then, the national debt has always been at least $500 billion more than it was one year prior.
On the prior day that is common between the two years, 10/30/15, the nation debt was $18.153 trillion. One year prior, on 10/30/14, the debt was $17.914 trillion. The difference is $239 billion.
So you know where I am going with this. On what day is the national debt consistently $1 trillion more that it was on the same date the prior year. And the answer is, we haven't reached that point yet, but we are almost there. I expect we will reach it by the middle of September.
=============================
Update: That is the wrong answer.
The correct answer is 9/8/17. On this day, the national debt was $20.162 trillion. One year prior, on 9/8/16, the total debt was $19.482 trillion. The difference is $680 billion.
On the prior day, 9/7/17, the national debt was $19.845 trillion. One year prior, on 9/7/16, the total debt was $19.479 billion, for a difference of $366 billion.
Dubai is an absolute mess
"Dubai is a terrible inefficient mess of land use with buildings, homes, malls, parks, your morning jogging track, all separated by a grid of massive highways. Without a car, every one of these areas is completely inaccessible. This isn't a city, its a series of attractions that you drive to from the suburbs."
Friday, August 16, 2019
WE will earn $3 trillion in revenue
"The We Company", formerly known as WeWork, just registered with the SEC to go public. I think they missed their window of opportunity of getting fools with money to invest. The company lost $4 billion over the last 3 years and will likely never be profitable. But supposedly they will earn $3 Trillion, with a capital T, of revenue. I'm trying to find the section that says that.
And here it is: "Data from CBRE Group and Cushman & Wakefield indicates that employers across 155 global cities for which data is available and in which we have existing or planned locations spend a weighted average of approximately $11,700 in occupancy costs per employee each year. By applying the average employee occupancy costs to our potential member population of 149 million people in our existing 111 cities, we estimate a total opportunity of $1.7 trillion. Among the approximately 255 million potential members across our 280 target cities globally, we estimate a total opportunity of $3.0 trillion."
To restate this, they are focusing on 280 target cities globally [by the way I am very interested as to the list of cities]. In each city, they will host nearly 1 million "employee occupants" (255/280 = .91, so actually an average of 910,000 per city. Each employee occupant will cost $11,700 per year, or almost $1,000 per month. So 280 cities X 910,000 per city X $11,700 = $3 trillion of revenue. Per Year. At least they dream big.
So what are the cities, at least the 111 current ones? And can they really get $10 billion of revenue per year from each of these cities?
===============================
And here it is from https://www.wework.com/locations. This has 124.
United States
Atlanta
Austin
Baltimore
Boston
Boulder
Charlotte
Chicago
College Park, MD
Columbus
Dallas - Fort Worth
Denver
Detroit
Houston
Indianapolis (coming soon)
Kansas City
Las Vegas
Los Angeles
Miami
Minneapolis
Nashville
New York City
Orange County
Orlando
Philadelphia
Phoenix
Pittsburgh (coming soon)
Portland
Raleigh-Durham
SF Bay Area
Sacramento
Salt Lake City
San Antonio (coming soon)
San Diego
Seattle
St. Louis (coming soon)
Tampa
Washington, D.C.
Argentina - Buenos Aires
Australia
Brisbane
Melbourne
Perth
Sydney
Belgium - Brussels
Brazil
Belo Horizonte
Brasilia
Porto Alegre
Rio de Janeiro
São Paulo
Canada
Calgary
Montreal
Toronto
Vancouver
Chile - Santiago de Chile
Colombia
Barranquilla
Bogotá
Medellín
Costa Rica - San José
Czech Republic - Prague
Denmark - Copenhagen
France - Paris
Germany
Berlin
Cologne
Frankfurt
Hamburg
Munich
Greater China
Beijing
Chengdu
Guangzhou
Hangzhou
Hong Kong
Nanjing
Shanghai
Shenzhen
Suzhou
Taipei
Wuhan
Xi'An
India
Bengaluru
Gurugram
Hyderabad (coming soon)
Mumbai
Noida
Pune
Indonesia - Jakarta
Ireland - Dublin
Israel
Be'er Sheva
Haifa
Herzliya
Jerusalem
Tel Aviv
Italy - Milan
Japan
Fukuoka
Kobe
Nagoya
Osaka
Tokyo
Yokohama
Malaysia - Kuala Lumpur
Mexico - Guadalajara
Mexico City
Monterrey
Netherlands - Amsterdam
Norway - Oslo
Peru - Lima
Philippines - Manila
Poland - Warsaw
Russia - Moscow
Singapore - Singapore
South Africa
Cape Town
Johannesburg
South Korea
Busan
Seoul
Spain
Barcelona
Madrid
Sweden - Stockholm
Thailand - Bangkok
United Arab Emirates
Abu Dhabi
Dubai (coming soon)
United Kingdom
Birmingham
Cambridge
Edinburgh
London
Manchester
Vietnam - Ho Chi Minh City
Wednesday, August 14, 2019
Bellacosa
This is the most interesting music video I have seen in a long long time. Its kind of like the old MTV ones. Just turn the sound off, the music itself is horrible, in my opinion. The artist is Bad Bunny.
Tuesday, August 13, 2019
2117: a tale of two century bonds
A century bond matures in 100 years. In June 2017, Argentina sold $2.75 billion of 100-year bonds, maturing in 2117, with a yield of 7.9%.

In September 2017, Austria sold 3.5 billion euros of 100-year bonds, maturing in 2117 with a yield of 2.1%.

Both of these charts have downward-sloping lines, but the Argentina chart measures par, whereas the Austria chart measures yield. So in otherwords, the Austria chart should be inverted.
Which would you rather buy? The Argentina bonds are certain to default within 20 years. The Austria bonds are extremely overpriced, selling at something like 186% of par. So even if 1) the Austria state survives for 100 years, and 2) the Euro survives for 100 years, and 3) the inflation rate of the Euro remains below 1% for the next 100 years, then you are guaranteed to lose 86% of your investment.
Both are horrible investments.
Update: Here is a chart showing the par value of an Austrian 100-year bond. It is going up just as fast as the Argentinian bond is going down.

Monday, August 12, 2019
2019 Long-Term Budget Outlook
See also: https://www.cbo.gov/publication/55544
The CBO thinks that interest payments could be as much as 20% of total spending by 2049. They are much more pessimistic than me. I think interest payments will make up only 13% of total spending that year.
They also warn that in the worst-case scenario, called the "Extended Alternative Fiscal Scenario", that the debt held by the public could be as much as 219% of GDP in 2049.
I really think that we as a country can't survive in any way recognizable to us today if the debt exceeds 150% of GDP. When will that happen in their worst case scenario? Probably somewhere between 2037 and 2043, call it 2040. That's only 21 years from now. Does anyone care? I don't think so.
Fiscal Year To Date Deficit Hits $867 Billion
See https://www.fiscal.treasury.gov/files/reports-statements/mts/mts0719.pdf
There are still two months left in the fiscal year. The last fiscal year to date deficit at this point was $684 Billion, so this is running $183 billion higher. In the last two months of the last fiscal year, the government spent $95 billion. So we anticipate that the total deficit for FY 2019 will be about $970 billion and won't hit $1 trillion. It will easily exceed $1 trillion next year, although the CBO claims that $1 trillion won't be reached until 2022. The CBO hasn't taken into account the extra spending from the last budget deal and they need to update their models.
Update: The Treasury is predicting that the deficit will be $1 trillion this fiscal year.
Total revenues (on-budget and off-budget) of: 3,472,324
Total outlays (on-budget and off-budget) of: 4,472,961
Total deficit for Fiscal Year 2019 (in millions): -1,000,637
Wow, and it isn't even a recession year yet.
Sunday, August 11, 2019
Egypt's New Capital
Egypt is planning on building a new capital, 40 km east of Cairo. The project doesn't even have a name yet. It won't be New Cairo, because that name is already taken.
Update: The name is Wedian.
The new city will cost $45 billion, hold 6.5 million people, and cover 700 sq km. It will have some similarities to Neom, the new city planned by Saudi Arabia in its far northwest.
The problem, as the video points out, is that Egypt has built multiple new planned cities in the last 30 years that have failed. Some of these are like China's ghost cities. The problem is that it will be expensive to live there, even for middle-class people, so only rich people will live there, and there aren't enough of them to fill it.
====================
Here is another article about new Egyptian cities: https://www.theguardian.com/cities/2019/jul/10/new-cities-in-the-sand-inside-egypts-dream-to-conquer-the-desertToday there are 22 built or part-built Egyptian new cities – and the New Urban Communities Authority (NUCA) has plans for 19 more. Around 7 million people now call these new cities home. It is arguably the most ambitious new cities programme the world has ever seen – a dream of bustling cities in an almost lunar desert landscape that outstrips the visions of even China and India.
Saturday, August 10, 2019
Crisis in 2047
I decided to do a new projection, and this one, showing a breaking point in 2047, is considerably worse than the prior one, which showed that the system could survive until 2068.
Here are my assumptions:
1. The primary source comes from the CBO 2019 Long-Term Budget Outlook.
2. The numbers for GDP comes from the Social Security projection. However, I assume that there is a recession every 11 years. I assume that this will cause the nominal GDP to remain the same for the year. I assume recessions will occur in 2021, 2032, and 2043.
3. Revenue numbers will fluctuate with GDP.
4. Social Security and Medicate projections are given as a percent of GDP, but I don't think they will actually drop. So I use the actual projections from the Social Security and Medicare trust funds.
5. I assume that interest will never exceed 2.6% of the prior year public debt.
I'm not saying that this is necessarily more accurate that the previous one, or that either are accurate. They both are possible forecasts of the future. I think this shows that interest is not necessarily a problem as the long-term outlook for interest rates is decreasing.
The problem is the entitlement spending, which is Social Security, Medicare, Other Health, and Other Mandatory Spending. Other Health is defined as "Medicaid, and the Children’s Health Insurance Program, as well as outlays to subsidize health insurance purchased through the marketplaces established under the Affordable Care Act and related spending" (source CBO).
This shows that Debt Held by the Public will first reach $50 trillion by 2037. This number is slightly more than $16 trillion now. So it will triple in the next 18 years. (The previous forecast showed it reaching $50 trillion by 2040). I also show it reaching $100 trillion in 2048, whereas the previous forecast showed it reaching $100 trillion in 2053.
Update (2/8/20): The next time I redo this, I think it should take into account non-budgetary items that go into the public debt, which are mostly student loans, and the Fed-owned notes and bonds which are longer than 1 year should be subtracted.
Here are my assumptions:
1. The primary source comes from the CBO 2019 Long-Term Budget Outlook.
2. The numbers for GDP comes from the Social Security projection. However, I assume that there is a recession every 11 years. I assume that this will cause the nominal GDP to remain the same for the year. I assume recessions will occur in 2021, 2032, and 2043.
3. Revenue numbers will fluctuate with GDP.
4. Social Security and Medicate projections are given as a percent of GDP, but I don't think they will actually drop. So I use the actual projections from the Social Security and Medicare trust funds.
5. I assume that interest will never exceed 2.6% of the prior year public debt.
| Other | Other | Total | Debt | Debt % | ||||||||
| Year | Revenues | SS | Medicare | Health | Mand | Discret | Interest | Outlays | Deficit | Public | GDP | of GDP |
| 2019 | 3,511 | 1,058 | 801 | 344 | 559 | 1,354 | 382 | 4,497 | -986 | 16,737 | 21,485 | 77.9% |
| 2020 | 3,761 | 1,126 | 901 | 360 | 586 | 1,396 | 428 | 4,797 | -1,036 | 17,773 | 22,523 | 78.9% |
| 2021 | 3,819 | 1,188 | 928 | 362 | 565 | 1,379 | 452 | 4,873 | -1,054 | 18,827 | 22,600 | 83.3% |
| 2022 | 4,012 | 1,265 | 1,004 | 378 | 566 | 1,416 | 489 | 5,125 | -1,113 | 19,939 | 23,600 | 84.5% |
| 2023 | 4,248 | 1,348 | 1,083 | 395 | 593 | 1,457 | 518 | 5,420 | -1,171 | 21,110 | 24,700 | 85.5% |
| 2024 | 4,489 | 1,438 | 1,169 | 413 | 619 | 1,496 | 549 | 5,728 | -1,239 | 22,350 | 25,800 | 86.6% |
| 2025 | 4,725 | 1,533 | 1,259 | 432 | 648 | 1,539 | 581 | 6,059 | -1,334 | 23,683 | 27,000 | 87.7% |
| 2026 | 4,963 | 1,634 | 1,354 | 451 | 677 | 1,579 | 616 | 6,400 | -1,437 | 25,120 | 28,200 | 89.1% |
| 2027 | 5,204 | 1,742 | 1,452 | 470 | 706 | 1,617 | 653 | 6,751 | -1,547 | 26,667 | 29,400 | 90.7% |
| 2028 | 5,465 | 1,857 | 1,591 | 491 | 737 | 1,658 | 693 | 7,163 | -1,699 | 28,365 | 30,700 | 92.4% |
| 2029 | 5,728 | 1,973 | 1,703 | 512 | 768 | 1,696 | 737 | 7,548 | -1,820 | 30,185 | 32,000 | 94.3% |
| 2030 | 6,012 | 2,093 | 1,818 | 568 | 768 | 1,737 | 785 | 7,953 | -1,941 | 32,126 | 33,400 | 96.2% |
| 2031 | 6,299 | 2,218 | 1,936 | 592 | 766 | 1,775 | 835 | 8,330 | -2,032 | 34,158 | 34,800 | 98.2% |
| 2032 | 6,352 | 2,349 | 2,058 | 593 | 768 | 1,745 | 888 | 8,595 | -2,243 | 36,401 | 34,900 | 104.3% |
| 2033 | 6,661 | 2,484 | 2,183 | 619 | 801 | 1,820 | 946 | 9,071 | -2,410 | 38,810 | 36,400 | 106.6% |
| 2034 | 6,992 | 2,622 | 2,313 | 646 | 836 | 1,900 | 1,009 | 9,571 | -2,579 | 41,389 | 38,000 | 108.9% |
| 2035 | 7,326 | 2,764 | 2,447 | 673 | 871 | 1,980 | 1,076 | 10,081 | -2,755 | 44,144 | 39,600 | 111.5% |
| 2036 | 7,682 | 2,911 | 2,585 | 702 | 909 | 2,065 | 1,148 | 10,618 | -2,936 | 47,080 | 41,300 | 114.0% |
| 2037 | 8,041 | 3,067 | 2,723 | 731 | 946 | 2,150 | 1,224 | 11,165 | -3,124 | 50,204 | 43,000 | 116.8% |
| 2038 | 8,441 | 3,230 | 2,860 | 763 | 988 | 2,245 | 1,305 | 11,747 | -3,306 | 53,510 | 44,900 | 119.2% |
| 2039 | 8,845 | 3,399 | 2,999 | 796 | 1,030 | 2,340 | 1,391 | 12,342 | -3,497 | 57,007 | 46,800 | 121.8% |
| 2040 | 9,272 | 3,575 | 3,142 | 878 | 1,025 | 2,440 | 1,482 | 12,963 | -3,691 | 60,698 | 48,800 | 124.4% |
| 2041 | 9,671 | 3,757 | 3,288 | 916 | 1,069 | 2,545 | 1,578 | 13,611 | -3,940 | 64,638 | 50,900 | 127.0% |
| 2042 | 10,089 | 3,946 | 3,436 | 956 | 1,115 | 2,655 | 1,681 | 14,285 | -4,196 | 68,834 | 53,100 | 129.6% |
| 2043 | 10,108 | 4,146 | 3,591 | 958 | 1,117 | 2,660 | 1,790 | 14,706 | -4,598 | 73,432 | 53,200 | 138.0% |
| 2044 | 10,545 | 4,357 | 3,753 | 999 | 1,166 | 2,775 | 1,909 | 15,436 | -4,891 | 78,322 | 55,500 | 141.1% |
| 2045 | 11,020 | 4,581 | 3,927 | 1,044 | 1,218 | 2,900 | 2,036 | 16,222 | -5,202 | 83,524 | 58,000 | 144.0% |
| 2046 | 11,495 | 4,819 | 4,108 | 1,089 | 1,271 | 3,025 | 2,172 | 17,034 | -5,539 | 89,062 | 60,500 | 147.2% |
| 2047 | 12,008 | 5,073 | 4,295 | 1,138 | 1,327 | 3,160 | 2,316 | 17,900 | -5,892 | 94,954 | 63,200 | 150.2% |
| 2048 | 12,540 | 5,345 | 4,488 | 1,188 | 1,386 | 3,300 | 2,469 | 18,809 | -6,269 | 101,223 | 66,000 | 153.4% |
| 2049 | 13,091 | 5,632 | 4,754 | 1,240 | 1,447 | 3,445 | 2,632 | 19,826 | -6,735 | 107,958 | 68,900 | 156.7% |
| 2050 | 13,661 | 5,939 | 5,033 | 1,294 | 1,510 | 3,595 | 2,807 | 20,895 | -7,234 | 115,191 | 71,900 | 160.2% |
I'm not saying that this is necessarily more accurate that the previous one, or that either are accurate. They both are possible forecasts of the future. I think this shows that interest is not necessarily a problem as the long-term outlook for interest rates is decreasing.
The problem is the entitlement spending, which is Social Security, Medicare, Other Health, and Other Mandatory Spending. Other Health is defined as "Medicaid, and the Children’s Health Insurance Program, as well as outlays to subsidize health insurance purchased through the marketplaces established under the Affordable Care Act and related spending" (source CBO).
This shows that Debt Held by the Public will first reach $50 trillion by 2037. This number is slightly more than $16 trillion now. So it will triple in the next 18 years. (The previous forecast showed it reaching $50 trillion by 2040). I also show it reaching $100 trillion in 2048, whereas the previous forecast showed it reaching $100 trillion in 2053.
Update (2/8/20): The next time I redo this, I think it should take into account non-budgetary items that go into the public debt, which are mostly student loans, and the Fed-owned notes and bonds which are longer than 1 year should be subtracted.
Subscribe to:
Posts (Atom)