Monday, December 30, 2013

Xiamen is the San Diego of China

San Diego, California "is the birthplace of California and is known for its mild year-round climate, natural deep-water harbor, extensive beaches, long association with the U.S. Navy, and recent emergence as a healthcare and biotechnology development center". The population was estimated to be 1,322,553 as of 2012.  It has a very high quality of life.  It is 2600 miles from San Diego to Honolulu.


San Diego

Xiamen, Fujian province, has a population of 3.67 million.  "Xiamen and its surrounding countryside is known for its scenery and tree-lined beaches. Xiamen has a monsoonal humid subtropical climate characterised by long, hot and humid summers (but moderate compared to much of the rest of the province) and short, mild and dry winters.  The Port of Xiamen is a large deepwater port situated on the northern part of Xiamen Island. It has an excellent natural harbour and well connected to the mainland by road and rail. Xiamen University is a beautiful campus with old traditional buildings and a tranquil lake outside the foreign language department.  In 2006, Xiamen was ranked as China's second 'most suitable city for living', as well as China's 'most romantic leisure city' in 2011."  It is about 190 miles from Xiamen to Taipei.


Xiamen

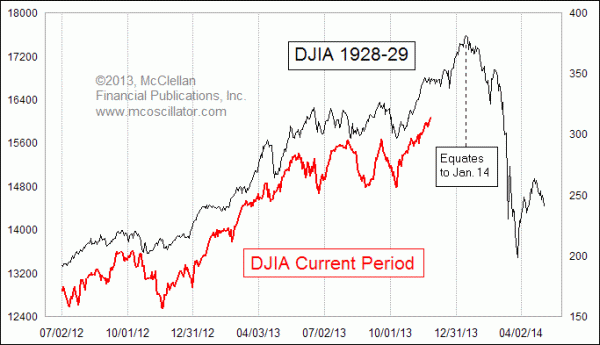
Crash on January 14, 2014?


I don't think so, but if the current correlation holds it will.


100 Best Cities in the World

This list combines quality of life rankings (from Mercer) with GDP/Population.  The result is a city that has a very nice atmosphere and also provides a nice standard of living.  So bigger is better (more opportunity), but with too big a city you get smog and traffic and pay higher rent.  This attempts to show the optimum balance.  A lower score is better here.  These are in caps because one of my sources was in caps and it is too much work to modify.

To show an example of how this works, Vienna is ranked #1 for quality of life, but #81 in power, for a point score of 82. Tokyo is ranked #66 for quality of life, but #1 in power, for a total of 67.

There is a bias in favor of European cities (especially Germany) and against China, but that is what the survey results show. US cities are in bold.

1 DÜSSELDORF (Rhine-Ruhr) GERMANY 33
2 SYDNEY AUSTRALIA 36
3 PARIS FRANCE 38
4 TORONTO CANADA 39
5 SINGAPORE SINGAPORE 42
6 AMSTERDAM/ROTTERDAM (Randstad) NETHERLANDS 53
7 MELBOURNE AUSTRALIA 54
8 LONDON UK 55
9 SAN FRANCISCO/ OAKLAND/SAN JOSE, CA US 58
10 NEW YORK CITY, NY US 60
11 CHICAGO, IL US 63
12 FRANKFURT GERMANY 67
13 TOKYO/YOKOHAMA JAPAN 67
14 BOSTON, MA US 68
15 WASHINGTON, DC US 73
16 OSAKA/KOBE/KYOTO JAPAN 76
17 BERLIN GERMANY 77
18 MONTREAL CANADA 79
19 VIENNA AUSTRIA 82
20 MILAN ITALY 95
21 LOS ANGELES, CAUS 95
22 HAMBURG GERMANY 104
23 BARCELONA SPAIN 105
24 MADRID SPAIN 109
25 PHILADELPHIA, PA US 109
26 BRUSSELS BELGIUM 110
27 VANCOUVER CANADA 112
28 DALLAS, TX US 112
29 HOUSTON, TX US 113
30 STOCKHOLM SWEDEN 118
31 SEATTLE, WA US 124
32 NAGOYA JAPAN 125
33 COPENHAGEN DENMARK 126
34 HONG KONG HONG KONG 127
35 MIAMI, FL US 131
36 SEOUL/INCHEON SOUTH KOREA 133
37 LISBON PORTUGAL 136
38 ATLANTA, GA US 136
39 MUNICH GERMANY 137
40 SAN DIEGO, CA US 142
41 ROME ITALY 142
42 MINNEAPOLIS/ST. PAUL, MN US 154
43 BRISBANE AUSTRALIA 155
44 DENVER, CO US 155
45 FUKUOKA JAPAN 155
46 BIRMINGHAM UK 161
47 BUENOS AIRES ARGENTINA 162
48 NAPLES ITALY 164
49 PERTH AUSTRALIA 169
50 PORTLAND, OR US 185
51 DUBAI/SHARJAH UNITED ARAB EMIRATES 186
52 SHANGHAI CHINA 186
53 TAIPEI TAIWAN 187
54 PHOENIX/SCOTTSDALE, AZ US 188
55 DUBLIN IRELAND 190
56 MANCHESTER UK 196
57 KUALA LUMPUR MALAYSIA 198
58 DETROIT, MI US 202
59 BEIJING CHINA 209
60 ZURICH SWITZERLAND 211
61 PITTSBURGH, PA US 213
62 BUSAN SOUTH KOREA 213
63 OSLO NORWAY 215
64 SAO PAULO  BRAZIL 216
65 BALTIMORE, MD US 219
66 SANTIAGO CHILE 221
67 ST. LOUIS, MO US 222
68 TAMPA, FL US 222
69 LEEDS/BRADFORD (WEST YORKSHIRE) UK 223
70 ATHENS GREECE 223
71 HANGZHOU CHINA 225
72 GUANGZHOU/FOSHAN CHINA 226
73 AUCKLAND NEW ZEALAND 228
74 SAPPORO JAPAN 228
75 MEXICO CITY MEXICO 232
76 ISTANBUL TURKEY 233
77 BANGKOK THAILAND 235
78 KANSAS CITY, MO US 238
79 RIO DE JANEIRO BRAZIL 239
80 TEL AVIV ISRAEL 245
81 STUTTGART GERMANY 246
82 AUSTIN, TX US 247
83 JOHANNESBURG SOUTH AFRICA 249
84 BUDAPEST HUNGARY 258
85 CALGARY CANADA 259
86 CINCINNATI, OH US 260
87 LYON FRANCE 261
88 LAS VEGAS, NV US 262
89 SHENZHEN CHINA 264
90 MONTERREY MEXICO 265
91 KUWAIT CITY KUWAIT 265
92 ABU DHABI UNITED ARAB EMIRATES 266
93 WARSAW POLAND 266
94 CLEVELAND, OH US 267
95 BELO HORIZONTE BRAZIL 268
96 SAN ANTONIO, TX US 269
97 CAPE TOWN SOUTH AFRICA 269
98 TIANJIN CHINA 272
99 ORLANDO, FL US 273
100 HELSINKI FINLAND 276

Sunday, December 29, 2013

Chengdu

Saturday, December 28, 2013

Friday, December 27, 2013

Paying cash for condos in Miami

This remarkable boom in high-end real estate has been driven by foreign money, with “buyers coming from all over the world but with the highest concentration from Venezuela, Argentina, Brazil and Russia," ... Seventy-six percent of condo buyers in Miami don’t take out mortgages but pay cash, versus a national average of 32 percent for cash sales for all properties.  ... Corruption and bribery cost developing countries up to $1 trillion per year—lost revenues they are increasingly serious about attempting to recapture. Some of the money ends up in traditional offshore havens like Nevis, Bermuda and the British Virgin Islands, and huge amounts also flow to Western financial centers like Geneva, London and New York. But Miami, and its real estate market in particular, is an especially popular haven for ill-gotten cash.
http://www.thenation.com/article/176486/miami-where-luxury-real-estate-meets-dirty-money

Thursday, December 26, 2013

Unamortized Premiums

I just noticed this.  The Federal Reserve has a line item on their balance sheet called "Unamortized premiums on securities held outright".  What is this?  "Basically, the Fed has been consistently buying large amounts of bonds via QE at a price above their face value. This premium gets added to the unamortized premium category."

How much is it?  208,882.  That's $209 billion.  The Fed paid $209 billion more than the face value of bonds.  (Their total capital is only $55 billion).  Wow.  What if they had to sell some bonds in a hurry?  They wouldn't be receiving a premium, that's for sure.

Wednesday, December 25, 2013

O Come All Ye Faithful

Trans Siberian Orchestra


The Nutcracker on steroids.

Minuit, Chretiens


I think this is the best Christmas carol ever written.  It is the original French version of "O Holy Night".

Margin Debt

Source: http://www.nyxdata.com

Yeah! It keeps going up.  Just don't ask what happens when it stops rising.  "Few people are able to get out of the way of a self-reinforcing downward spiral. That’s how margin debt, normally a sign of investor confidence, becomes a nightmare on steroids."  

See also: http://aftermath2022.blogspot.com/2013/11/nyse-margin-debt.html

The Queen's Christmas Message

Coventry Carol


I dislike most of the fake politically correct holiday songs.  This is the real thing. It has a sad haunting melody. "The carol refers to the Massacre of the Innocents, in which Herod ordered all male infants under the age of two in Bethlehem to be killed. The lyrics of this haunting carol represent a mother's lament for her doomed child."

Tuesday, December 24, 2013

The Wolf of Bedford Falls


George Bailey in an alternate universe, takes the job from Mr. Potter, makes a lot of money and throws wild parties, before his life spins out of control, and the auditors catch up with him.

Abu Dhabi Metro

Khalifa City

Masdar


See video at http://www.bloomberg.com/video/masdar-a-green-city-bloomberg-brink-05-13-azsX~xTlSsOJO3BGwX0ufg.html

Monday, December 23, 2013

Revised Dow

The famous Dow Jones Industrial Average is made up of 30 stocks.  But these aren't the biggest companies.  Alcoa, which was a member until Sept 23, has a market cap of only $10 billion.  Part of the criteria for listing is stock price, as if that means anything.  Here is my list of 30 stocks that should be used instead.  It includes international stocks, as long as they are listed on the NYSE.  Stocks in bold are also on the DJIA.  I was trying to find companies with at least $150 billion market cap, which BP doesn't have, but is close.  These are the monsters of the stock market.

AAPL Apple Inc 493,953
XOM Exxon Mobil 431,232
GOOG Google 367,706
MSFT Microsoft 307,280
BRK-A Berkshire Hathaway 289,740
GE General Electric 276,883
JNJ Johnson Johnson 259,694
WMT Wal-Mart 250,873
WFC Wells Fargo 236,939
CVX Chevron 235,738
RDS-B Royal Dutch Shell 228,780
PG Proctor Gamble 222,605
JPM JP Morgan Chase 216,952
HSBC HSBC Holdings PLC 214,120
CHL China Mobile Ltd 207,553
PTR Petrochina 202,442
IBM IBM 196,222
PFE Pfizer 196,020
NVS Novartis 191,101
TM Toyota Motor Co 187,625
VOD Vodafone 186,235
AMZN Amazon 184,087
T ATT 180,761
KO Coca Cola 176,977
BHP BHP Billiton Ltd 175,533
BAC Bank of America 166,452
BUD Anheuser-Busch 165,392
ORCL Oracle 165,120
C Citigroup 158,196
BP BP plc 147,140
Total 6,919,352

I might update this monthly.

Sunday, December 22, 2013

Epic Fail in Tianjin

Builders in Tianjin want to build the next Manhattan in Yujiapu, all at once.  There are dozens of skyscrapers under construction.  Then something went wrong, and construction has ground to a halt. It still may be finished someday, but it is more likely it will be abandoned.


"The way Zhang sees it, Yujiapu is more Detroit than Manhattan, and it hasn’t even been built yet. ... ten years from now, China’s property bubble will have burst, land will be worth around half of what it is now, and squatters will inhabit Yujiapu’s half-built skyscrapers, like something out of a "Mad Max" movie. This is going to be 'Apocolypse Then.' It’s sad.
http://www.marketplace.org/topics/world/chinas-hangover/china-replica-manhattan-loses-its-luster

See also:
http://thechinachronicle.com/chinas-manhattan-knock-off-aspires-to-be-bigger-and-better-than-the-real-thing/

To build Yujiapu, Tianjin officials are piling onto borrowing that is already at least almost half a trillion yuan"
http://www.bloomberg.com/news/2011-12-18/china-debts-dwarf-official-data-with-too-big-to-complete-alarms.html

Shanghai


Will it be the future economic capital of the world? It has a way to go.

BRT in Guangzhou

Largest Companies in the US


Total (as of 12/20/2013) 5,013,429

Here is the same list as of 12/31/12.  It is very hard to get historical shares outstanding, so I used the same figures.  So there are likely some errors here, but I just want to do a quick comparison.  The total increased by about 25% in 2013.


Why does this matter?  I think there is going to be a meltup and I want to watch these companies in particular.

Update:  Also look at HSBC (HSBC Holdings PLC) with 4000m shares at a price of 53.53 for a market cap of 214,120.

Meltup or Meltdown?

The SKEW index is at 143.20.  This measures the probability of a severe market correction.


So what happened the last 3 times the index was this high?

June 21, 1990 - "The recession of the early 1990s lasted from July 1990 to March 1991."  On June 21, 1990, the Dow closed at 2901.73. One Sept 21, 1990, the Dow closed at 2512.38, which was 13.4% lower.

Oct. 16, 1998 -  LTCM and Russian financial crisis. No recession.  On 10/16/1998, the Dow was at 8416.76.  On 1/15/1999, it was at 9340.55, and increase of 11%.

Mar 16, 2006 - Housing bubble peak.  The Great Recession began in Dec. 2007, almost 2 years later.  On 3/16/2006, the Dow was at 11,253.  On 6/16/2006, the Dow was at 11,015, a decrease of 2%.  But just a few days earlier, on 6/13/2006, the Dow was at 10,706, a decrease of 4.8%.

I think we are going to have a meltup before the meltdown.  A crash is inevitable, but usually occurs in September or October.  So my prediction is a rise of about 6%.  Now the Dow is at 16,221. It should be over 17,200 on 3/21/14, a rise of about 1000.

Also, sunspot cycles are a leading indicator - they usually max out 6-18 months before a crash.

Buy, buy, buy!

Warning: I am not a registered investment advisor.  My track record is close to zero.  Do your own research.

Saturday, December 21, 2013

The green shoots are starting to wither


See also: http://aftermath2022.blogspot.com/2013/04/tcmdo-change.html


Existing home sales

The recovery has stalled

Releveraging


Because credit cards are the answer to life, the universe, and everything.


Sunspot Cycles & Recessions

Source: http://www.oftwominds.com/blogdec13/case-for-crash12-13.html

This is very interesting.  Note that the 2007-2009 recession does not fit, but other than that it is an amazing correlation or coincidence.

Look at the last few sunspot cycles:
cycle 21 - began June 1976, peak month Dec. 1979
cycle 22 - began September 1986, peak month July 1989
cycle 23 - began May 1996, peak month March 2000
cycle 24 - began January 2008, peak in 2014
cycle 25 (predicted) - to begin about January 2019, peak about 2025

Now look at the list of recessions:
Jan-July 1980 and July 1981-Nov 1982
July 1990-March 1991
March 2001-Nov 2001
Dec 2007-June 2009 (Great Recession)

As mentioned, the Great Recession does not fit the pattern.  The average solar cycle lasts 11.1 years, but the last one, from May 1996 to January 2008 lasted 12.6 years.  The peak month usually occurs 3-4 years after the beginning of the cycle, but historically it has been as many as 6 years.  The recession usually follows the peak month by 6-12 months.

What is the current solar activity?
"The sun's current space-weather cycle is the most anemic in 100 years, scientists say.
Our star is now at "solar maximum," the peak phase of its 11-year activity cycle. But this solar max is weak, and the overall current cycle, known as Solar Cycle 24, conjures up comparisons to the famously feeble Solar Cycle 14 in the early 1900s, researchers said."

What happened in Solar Cycle 14? It began on February 1902 and peaked in February 1906.  This was followed by the Panic of 1907 starting with a bank run on October 22, 1907.  The stock market dropped by 50% during this period.

=========================
The correlation between sunspots and business crises is not new.  It was mentioned by British economist William Stanley Jevons in 1878 in his book "'Commercial Crises and the Sun-Spots".
 Jevons now argues that the recurrence of crises depends mainly on commerce with the East, and especially with India and China, where famines occur with the same periodicity as sunspots.  The failure of harvests in the East leads to a reduced exportation of European goods.  There is no relationship between the extent of manias or crises and the variation in foreign trade, but this variation forms the impulse for commercial changes in the West.  The impulse from abroad is like the match which fires the inflammable spirits of the speculative classes.

Much has been written about the absurdity of Jevons' sunspot explanation for business cycles.  However, Peart (1991) emphasizes that this theory is much more than a simple meteorological explanation of economic phenomena, because of Jevons' attention to mood fluctuations.  Price fluctuations due to harvest failures give rise to changed 'moods' of economic agents.  This results in altered investment decisions that multiply the effect of the harvest cycle, especially when 'mistaken' decisions are involved.  Source: Jevons' Economics by Bert Mosselmans.

Friday, December 20, 2013

Robert Moses

Dubai Palm Island

GDP up 6.2%

" Current-dollar GDP -- the market value of the nation's output of goods and services -- increased 6.2 percent, or $251.9 billion, in the third quarter to a level of $16,912.9 billion."
http://www.bea.gov/newsreleases/national/gdp/gdpnewsrelease.htm

The 6.2% is an annualized rate, and includes inflation of 1.8%.  Without inflation, the real annualized GDP rate increased at an annual rate of 4.1%.  The bigger GDP makes the debt-to-GDP ratio smaller.

Real Final Sales


What does it mean when real final sales drop below 2%?  Hmm... oh yea, the R word.


What is Treasury Currency Outstanding?

I think that Treasury Currency Outstanding (TCO) is very odd.

First of all, what is it?  The dictionary defines it as "currency (as coins, United States notes, or Federal Reserve notes) other than gold coin or gold certificates for which the U.S. Treasury is directly responsible".  So I guess it is mostly coins, but also includes a small amount of United States Notes in collectors hands, which still have value as currency.

Second of all, why is it an asset on the Federal Reserve Balance Sheet?  Federal Reserve Notes (e.g. dollar bills) are liabilities.  Here is an explanation:


Very complicated.  I will use symbols to try to understand this. 
N = Federal Reserve Notes Outstanding, which are a liability of the Federal Reserve.  To be specific, in this formula, it includes all FRNs, either in circulation or held by the government.
C = Treasury Currency Outstanding (mostly coins), which are a liability of the Treasury, either in circulation or held by the Fed.
TC = Federal Reserve Notes held by the Treasury, which are not in circulation.  Note that is not the Treasury's checking account with the Fed, this is actual cash that the government has in its safes.
CIC = Currency in circulation. If everybody in the world (excluding the Treasury) added up all the cash and coins in their pockets, wallets and safes, this would be the total.

Formulas:
CIC = N + C - TC
CIC + TC = N + C
N = CIC + TC - C

It is just an algebra problem.  So that is why coins in your pocket are treated as an asset on the Fed balance sheet, even though it has no control over them at all (it doesn't possess them, mint them, or issue them).

What about coins held by the U.S. government?  They have no value until placed in circulation.  What about coins held by the Fed?  The amount is probably small enough that it can be ignored.  But suppose it wasn't minuscule, suppose it had $100 billion worth of quarters (or platinum coins).  Now someone buys some of the coinage with FRNs.  The asset would be reduced, as would the liability (because a dollar bill in the hands of the Fed has no value).  But wait ... it is still an asset, even in private hands, so that doesn't balance.

Try #2, have a separate line item for Treasury Currency held by the Fed, as an asset. When someone buys coins, on the asset side it would change to Treasury Currency Outstanding.  On the liability side, there is no change in CIC, because N decreases and C increases by the same amount.

Thursday, December 19, 2013

The Social Security Crisis in 2029

Source: http://www.cbo.gov/sites/default/files/cbofiles/attachments/44972-SocialSecurity.pdf

Unless Social Security taxes are greatly increased with a 3%+ permanent tax increase, the social security trust will be totally exhausted in 2029, and benefits will be cut by 25%.

See http://www.zerohedge.com/contributed/2013-12-19/cbo-ss-another-29-crash.

On a related note, Intragovernmental Holdings peaked on 10/29/13 at $4.969 trillion.  For many years, more Social Security and Medicare taxes were taken in than benefits paid.  Now the situation has reversed and Social Security is in a permanent cash flow deficit.  Even if the rest of the government had a balanced budget, this would cause additional debt held by the public to be issued.


Wednesday, December 18, 2013

Classical Gas

Monday, December 16, 2013

Zhuhai


This is next door to Macau.

Sunday, December 15, 2013

The Lusosphere

What is the Lusosphere?  It is the world of Portuguese speaking countries.  What is interesting about it is that they all seem to be economically dynamic.  The line between "mother country" and "colony" is blurred, since the colonized countries want to maintain ties.  These are the main countries:

1. Portugal.  Capital: Lisbon. Pop. 10.5 million. GDP/person (PPP) $22,900.  Currency: euro. Portugal is in a recession, with GDP growth of -3.2%.

2. Brazil.  Capital: Brasilia. Pop. 201 million. GDP/person (PPP) $12,100.  Currency: real (about 2.3 BRL to 1 USD).  Largest city: Sao Paulo.  GDP growth: 0.9%.  The Olympics will be held in Rio de Janeiro in 2016.

3. Macau. Pop. 600,000. GDP/person (PPP) $82,400.  Currency: pataca (pegged to the HK dollar, about 7.8 MOP to 1 USD).  GDP growth: 10%.  The economy is based largely on tourism and gambling.

4. Angola. Capital: Luanda. Pop. 18.5 million. GDP/person (PPP) $6,300. Currency: Angolan kwanza (AOA), about 97.5 AOA to 1 USD. GDP growth: 8.4%.  The economy is based largely on oil and diamonds.

5. Mozambique. Capital: Maputo. Pop. 24 million. GDP/person (PPP) $1,200. Currency: metical. GDP growth: 7.5%.

6. Goa (state of India). Capital: Panjim.  Pop. 1.5 million.  GDP/person (PPP) $10,000.  Currency: Indian Rupee.  GDP growth: 8%.

7. East Timor. Capital: Dili. Pop. 1.2 million. GDP/person (PPP) $10,000. Currency: US dollar. GDP growth: 10%.

Base less Treasuries


Fiat Money


The title says "The Impending Collapse of the World Economy" but the video is mostly about true fiat money (non-debt based), such as tally sticks, the colonial money, and greenbacks issued by Lincoln.  This leads to an interesting thought - are we moving towards that now with Quantitative Easing?  Whatever government bonds purchased by the Fed are interest-free, because the Fed turns that money back over to the Treasury.

Saturday, December 14, 2013

Labuan - the next Singapore

"The financial sector here dreams of competing with Singapore or Hong Kong, but this place looks a lot more like a sleepy seaside village than a Far Eastern “dragon”. Labuan is “offshore” in more ways than one. There is oil here - lots of it - in the Brunei Gulf, the sultanate considered to be one of the world’s richest states. Labuan is also a member of the despised family of tax havens that the Organisation for Economic Co-operation and Development (OECD) is trying to bridle. It all began in 2010, when the Malaysian government decided to attract capital from rich Muslim countries so that it could develop a sort of Islamic finance industry. But capital influx has given way to legal shelters and discretion."

Canberra

Friday, December 13, 2013

Buffalo

M5 is flat

What does this mean?  The economy is stalled, even with $85 billion/mo of QE.

The rate of growth is on a downward slope.


Thursday, December 12, 2013

The recession begins now

Exhibit #1. The current recovery, if we are still in one, is the 6th longest since 1913.  Most boom-bust cycles are shorter.

Exhibit #2.  The stock market clearly topped out on Nov. 27, and will be facing a 5% correction (down to 15,300) at a minimum.  The stock market is a leading indicator of economic performance.  The Dow was at 13391 on 1/3/2013, and grew 20.2% through 11/27/2013.  Even if the stock market does not crash now, there is no way it will grow another 20% in 2014.

Exhibit #3.  NYSE Margin Debt reached an all-time high in October, and will almost certainly decline from there.  And one it starts going down, it tends to keep going down.  You know, margin calls.  This is usually a leading indicator of the stock market, but in this case the stock market is crashing first.  The November figures will be out after Christmas.

Exhibit #4.  New Orders keep declining.  Not by much, but the trend is clear.  This is the strongest signal.

Exhibit #5. Extended unemployment benefits for 1.3 million people will expire on Dec. 28.  This will have the effect of reducing the unemployment rate (ironically because people who don't get unemployment benefits are no longer considered to be unemployed).  These people probably won't be spending as much next year.

Exhibit #6. TCMDO, will still increasing, is increasing at a declining rate.  When the growth slope turns negative, this indicates a recession.

Exhibit #7. The Fed is likely to Taper by at least $5 billion per month at their meeting next week. The uncertainty over the budget is over, so they don't have that excuse to continue.  While QE is essentially meaningless and doesn't anything, this will spook the investors, as if they need any more reasons.

Exhibit #8.  M2 less Base keeps dropping.  Plus M2 Velocity keeps dropping.  If a growing economy needs a growing money supply, what does a shrinking money supply indicate?  Now note that M2 including base kept growing until about Nov 1 and has been flat or declined slightly since then.  So obviously the private sector is shrinking or at least deleveraging.  But the public sector isn't expanding fast enough to fill the gap.

Put a fork in the economy, it's done.  The Keynesians would say we need more stimulus.  But I say, let it go. Sell, sell, sell!

Update:
Initial claims for unemployment increased.  "In the week ending December 7, the advance figure for seasonally adjusted initial claims was 368,000, an increase of 68,000 from the previous week's revised figure of 300,000. The 4-week moving average was 328,750, an increase of 6,000 from the previous week's revised average of 322,750." http://www.dol.gov/opa/media/press/eta/ui/current.htm

WLI declines. "A measure of future U.S. economic growth edged lower last week, while the annualized growth rate also slowed, a research group said on Friday.  The Economic Cycle Research Institute, a New York-based independent forecasting group, said its Weekly Leading Index fell to 131.4 in the week ended Dec. 6 from a revised 132.7 the previous week, which originally had been reported as 132.8." http://www.businesscycle.com/ecri-news-events/news-details/economic-cycle-research-weekly-leading-drops-3

Update 2:  WLI drops again.  "The Economic Cycle Research Institute, a New York-based independent forecasting group, said its Weekly Leading Index eased to 130.9 in the week ended Dec. 13 from a revised 131.3 the previous week. That was originally reported as 131.4."