 Source: http://www.calibratedconfidence.com/2013/03/charts-at-glance.html
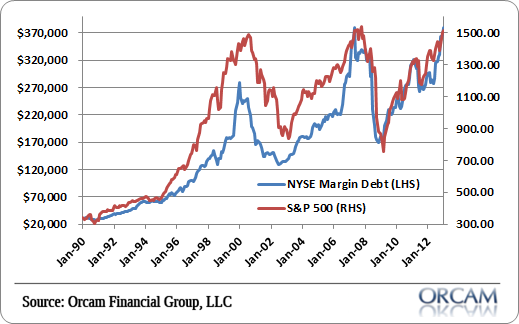
When the blue line rises above the red line, is that a sign of a crash? Where is the more recent data?
The source appears to be http://www.nyxdata.com/nysedata/asp/factbook/viewer_edition.asp?mode=table&key=3153&category=8
Here is the data for the last 3 months:
Jan 2013 $364,107 (bn)
Feb 2013 $366,139
Mar 2013 $379,522
I don't know what the numbers mean, but if they drop, that's a problem. This will happen after the stock prices drop so its not a leading indicator. Anyways it shows that the stock market is built on a foundation of sand.

Source: http://www.advisorperspectives.com/dshort/updates/NYSE-Margin-Debt-and-the-SPX.php
Warning sign?
=======================================================
Source: http://pragcap.com/nyse-margin-debt-approaches-all-time-high
Another chart.
No comments:
Post a Comment